
PMP User Guide v5.5

Using PMP 23
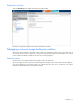
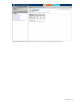
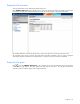
Display the storage status
Trace the performance issue by following the amber (Major) icon.
Click Storage in the navigation tree to access the storage information and display the status page for storage in the
right pane. Related and important counters for storage appear in the Analysis Data table.
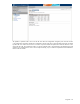
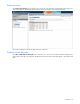
The Analysis Explanation indicates that at least one storage controller or network storage enclosure is reporting a
performance issue.
The remainder of this scenario examines other performance information available to assist in making a judgment
regarding the problem and determine if immediate action is required to resolve the performance bottleneck.
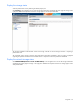
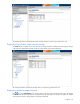
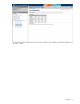
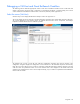
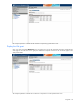
Display the network storage status
Click SGA04300BE (Enclosure name of MSA1500cs) in the navigation tree to access the storage information
and display the status page for storage in the right pane. Related and important counters for storage appear in the
Analysis Data table.