
PMP User Guide v5.5

Using PMP 22
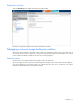
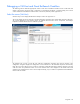
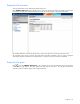
The problem or problems with a server can also be seen within the configuration navigation pane. The tree structure
in the configuration navigation displays the configuration of each node down to the individual components monitored
by PMP. The icons used in the tree next to a node or component indicate the performance status for that item or the
item under the node. The performance status icon for the selected node is also displayed in the Results frame. PMP
indicates many problems for the server in this example. Generally, only one node has a problem because bottlenecks
tend to mask one another.