
PMP User Guide v5.5

Using PMP 21
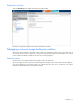
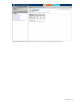
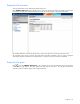
Display the inventory
Select the Inventory tab to display information for the selected drive.
Hardware or configuration details for the currently selected device appear.
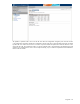
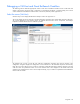
Debugging a network storage bottleneck condition
The following sections detail the appropriate actions to take when a bottleneck condition exists on network storage. In
this scenario, the server name is “pmpserver,” sharing network storage MSA1500cs. An amber (Major) icon in the PF
column indicates a bottleneck condition exists on the server named “pmpserver.”
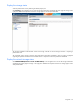
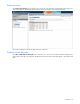
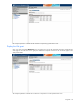
Select the server
Click the major icon to display the PMP Online Analysis window for “pmpserver.”
The screen displays the server node tree in the left configuration navigation pane and the Status tab in the right pane.
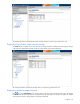
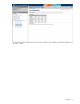
The counters displayed in the following figure are selected items from the various components. The Analysis
Explanation indicates that at least one node has a problem.