
PMP User Guide v5.5


Using PMP 18
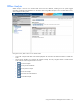
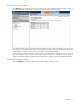
This graph displays the last 25 samples taken for the server. The duration of the graph is 25 times the sampling rate
of 10 seconds, or 4.16 minutes, as shown near the upper-right corner of the screen. The graph displays what
occurred on the server from 1:13 to 1:17 P.M.
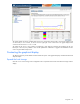
The pattern of the curves is rising, peaking, and declining, which might be caused by the completion of the new
batch job. In this case, the problem is over and the performance information is logged to the database for later
review using the Offline Analysis tool.
Contrasting the graphical display
The following sections provide details to further illustrate the power of the graphical display and demonstrate the full
depth of analysis.
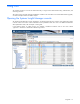
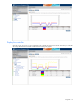
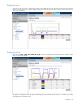
Expand the local storage
Click the + icon next to Storage in the configuration tree to expand the tree structure and select the storage node for
display.