
PMP User Guide v5.5

Using PMP 17
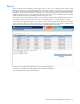
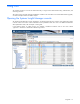
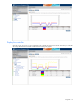
Display the memory status
Click Memory in the navigation tree to access the memory information and display the status page for memory in
the right pane. Related and important counters for memory appear in the Analysis Data table.
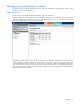
The explanation details a high average page read rate (reading from disk), and the available physical memory is less
than 20 MB. This condition indicates that the system needs more physical memory to handle the load, and this
recommendation is made. Many, but not all, recommendations suggest adding hardware.
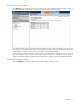
In this example, the situation could have occurred because a new batch job was assigned to run on the server at
night. The remainder of this scenario examines other performance information available to assist in making a
judgment regarding the problem and determine if immediate action is required to resolve the performance bottleneck.
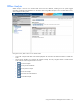
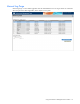
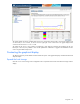
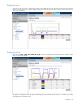
Display the memory graph
Select the Graph tab to change the right pane to a graphical display of memory counters.