
PMP User Guide v5.5

Using PMP 16
Debugging a server bottleneck condition
The following sections detail the appropriate actions to take when a bottleneck condition exists on a server. In this
scenario, the server name is “pmpserver.”
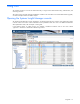
Select the server
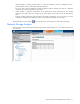
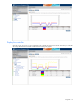
Click the major icon to display the PMP Online Analysis window for “pmpserver.”
The screen displays the server node tree in the left configuration navigation pane and the Status tab in the right pane.
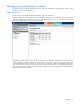
The counters displayed in the following figure are selected items from the various components. The Analysis
Explanation indicates that at least one node has a problem.
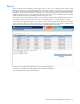
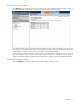
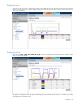
The problem or problems with a server can also be seen within the configuration navigation pane. The tree structure
in the configuration navigation displays the configuration of each node, down to the individual components
monitored by PMP. The icons used in the tree next to a node or component indicate the performance status for that
item or the item under the node. The performance status icon for the selected node is also displayed in the Results
frame. PMP indicates many problems for the server in this example. Generally, only one node has a problem because
bottlenecks tend to mask one another.