
PMP User Guide v5.5

Using the Performance Management Pack interface 11
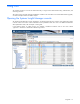
“Recommendation,” providing possible actions to relieve the bottleneck, and the “Configuration Issues,”
providing details about any issues detected for the components.
The server metrics and their definitions for data analyzed by PMP to determine the status of a particular
component are provided in Appendix A of this guide.
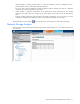
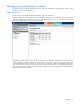
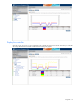
• Graph—Displays a graphical representation of the performance metrics associated with the selected
component. The graph is dynamic, changing as the values change, and contains the last 25 measurements
taken.
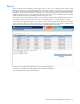
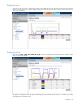
• Inventory—Displays information about the selected component configuration, such as the processor or NIC
configuration. Information provided in the Inventory view is detailed in Appendix A of this guide.
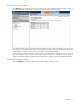
The Results frame provides a Help icon
in the top right corner, which displays a context-sensitive help page.
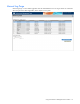
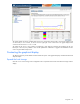
Network Storage Analysis
Network storage is licensed separately. Network storage Online Analysis appears in a new window separate from
server analysis.