
PMP User Guide v5.5

Using the Performance Management Pack interface 10
The interface is divided into three frames.
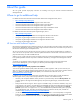
Systems detail frame
The Systems detail frame appears at the top left side of the browser window below the banner and provides the
following information:
• Server name—Displays the name of the server currently being monitored
• Server OS—Displays the operating system version of the server currently being monitored
• Server IP—Displays the IP address assigned to the server currently being monitored
• Sample Rate—Displays the frequency with which the agents are collecting performance data on the monitored
server
• Samples for Status—Displays the number of samples averaged to determine system performance status
• Alert—Indicates if alerts are to be sent when certain server performance status conditions occur
• Log—Indicates if the performance data is currently being logged for the selected server
• Set Threshold—Provides a link for modifying the performance threshold values for the selected server
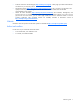
Server Tree frame
The Server Tree frame appears on the left side of the browser window. This frame is used to navigate between system
components. Component performance and status information appear in a hierarchical tree, with nodes for each level
of the component. This frame provides a view of the server, processors, memory, network connections, storage, host
bus components and virtual machine host components.
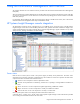
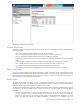
Results frame
The Results frame displays the status, inventory, and graphical representation for the selected server and its
components. Use the tabs in the Results frame to switch between these views. A list of the values corresponding to
each server and its components is provided in Appendix A of this guide.
The Results frame includes tabs to access the different representations of the information available for the server and
its components. The tabs are labeled Status, Graph, and Inventory. The tabs provide the following general
information:
• Status—Lists the performance counters (metrics) associated with the selected component. The table provides the
average, maximum, minimum, and last (current) values for all the counters. A status icon indicates the
performance of the component. An increasing level of severity is indicated as the status changes from normal to
major. The Status tab includes the “Analysis Explanation,” explaining why a bottleneck exists, the