
Fault Monitoring on Windows Integrity Servers
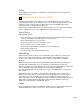
Type of Errors
The NIC Agent service monitors connectivity lost, connectivity restored, redundancy lost, and
redundancy restored. In addition, it indicates virus activity detection status from the Virus
Throttle Filter Driver. The Virus Throttle Filter Driver detects virus like activity and attempts to
minimize potential damage according to its configuration parameters.
Methodology
The NIC Agent collects data at the data collection interval set in the control panel applet,
(default is 2 minutes). For connectivity status, NIC Agent queries the miniport driver using a
generic OID. For virus like activity, monitoring is through WMI.
Output
• An SNMP trap is set and a message logged to Windows System Log (source is “NIC
Agents”)
• SMH NIC page shows status
• When connectivity status changes, an IML event is logged in directory:
HKLM\SYSTEM\Hewlett-Packard\Management Software\Soft IML\IML
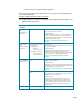
Foundation Agent Service
The Foundation Agent service reports several pieces of host information, including: software
versions, software running monitoring, memory usage, processor usage, cluster
configuration, file system usage, OS information (for example, version, name, type, and
description), and system status (for example, consolidated MIB status, Host GUID, and
platform type). In addition, Foundation Agents report information related to and detected by
the Operating System, including: number of threads, number of processors, up time, status,
list of processes running, list of processors plugged, cache information, memory information,
paging file information, physical and logical disks information, network interface information,
and TCP statistics. These agents report a condition for all information detected by Operating
system.
Foundation Agent service also provides a threshold agent to monitor performance thresholds
for various components (for example, .whether storage allocation settings for a crash memory
dump are sufficient).
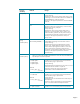
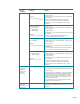
Type of Errors
a. Performance thresholds for the following components:
• CPU usage
• Logical disks busy time
• File system space usage
• Paging file usage
b. Crash dump size and whether the current specified value is sufficient to hold the dump
c. Start and stop information for each generated process (trap or event)
Page 11