
User Manual
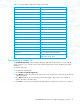


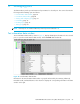
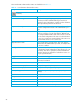

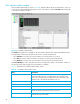

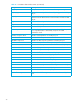
Table Of Contents
- Contents
- About this guide
- Using McDATA Web Server/Element Manager
- Managing Fabrics
- Securing a fabric
- Security consistency checklist
- Connection security
- User account security
- Remote authentication
- Device security
- Edit Security dialog
- Create Security Set dialog
- Create Security Group dialog
- Create Security Group Member dialog
- Editing the security configuration on a switch
- Viewing properties of a security set, group, or member
- Security Config dialog
- Archiving a security configuration to a file
- Activating a security set
- Deactivating a security set
- Configured Security data window
- Active Security data window
- Fabric services
- Rediscovering a fabric
- Displaying the event browser
- Working with device information and nicknames
- Zoning a fabric
- Zoning concepts
- Managing the zoning database
- Managing the active zone set
- Managing zones
- Merging fabrics and zoning
- Securing a fabric
- Managing switches
- Managing user accounts
- Configuring RADIUS servers
- Displaying switch information
- Configuring port threshold alarms
- Paging a switch
- Setting the date/time and enabling NTP client
- Resetting a switch
- Configuring a switch
- Archiving a switch
- Switch binding
- Restoring a switch
- Restoring the factory default configuration
- Downloading a support file
- Installing Product Feature Enablement keys
- Installing firmware
- Displaying hardware status
- Managing ports
- Glossary
- Index

88
Port statistics data window
The Port Statistics data window, shown in Figure 40, displays statistics about port performance. Select one
or more ports in the faceplate display that you want to view statistics. Click the Port Stats data window tab
to open the Port Statistics window.
Figure 40 Port Statistics data window
The Statistics drop-down list is available on the Port Statistics data window, and provides different ways to
view detailed port information. Click the down arrow to open the drop-down list.
• Select Absolute to view the total count of statistics since the last switch or port reset.
• Select Rate to view the number of statistics counted per second over the polling period.
• Select Baseline to view the total count of statistics since the last time the baseline was set.
Click Clear Baseline to set the current baseline when viewing baseline statistics. The baseline will also be
set when the switch status changes from unreachable to reachable.
Table 18 describes the Port Statistics data window entries.
Table 18 Port statistics data window entries
Entry Description
Start Time The beginning of the period over which the statistics apply. The start
time for the Absolute view is not applicable. The start time for the
Rate view is the beginning of polling interval. The start time for the
Baseline view is the last time the baseline was set.
End Time The last time the statistics were updated on the display.
Total Time Total time period from start time to end time.
Al Init Number of times the port entered the initialization state.
AL Init Error Number of times the port entered initialization and the initialization
failed. Increments count when port has a sync loss.
Bad Frames Number of frames that were truncated due to a loss of sync or the
frame didn't end with an EOF.