
User Manual


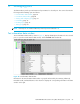
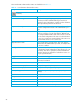

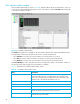

Table Of Contents
- Contents
- About this guide
- Using McDATA Web Server/Element Manager
- Managing Fabrics
- Securing a fabric
- Security consistency checklist
- Connection security
- User account security
- Remote authentication
- Device security
- Edit Security dialog
- Create Security Set dialog
- Create Security Group dialog
- Create Security Group Member dialog
- Editing the security configuration on a switch
- Viewing properties of a security set, group, or member
- Security Config dialog
- Archiving a security configuration to a file
- Activating a security set
- Deactivating a security set
- Configured Security data window
- Active Security data window
- Fabric services
- Rediscovering a fabric
- Displaying the event browser
- Working with device information and nicknames
- Zoning a fabric
- Zoning concepts
- Managing the zoning database
- Managing the active zone set
- Managing zones
- Merging fabrics and zoning
- Securing a fabric
- Managing switches
- Managing user accounts
- Configuring RADIUS servers
- Displaying switch information
- Configuring port threshold alarms
- Paging a switch
- Setting the date/time and enabling NTP client
- Resetting a switch
- Configuring a switch
- Archiving a switch
- Switch binding
- Restoring a switch
- Restoring the factory default configuration
- Downloading a support file
- Installing Product Feature Enablement keys
- Installing firmware
- Displaying hardware status
- Managing ports
- Glossary
- Index
84
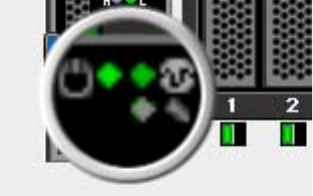
Displaying hardware status
To display a summary of the hardware status information in a popup text box, rest the cursor over the
chassis LED cluster in the faceplate display.
• Power LED—Indicates the voltage status of the switch.
• Heartbeat LED—Indicates the general status of the internal switch processor and the results of the POST.
• System Fault LED—Indicates an error, such as an over temperature condition, internal system error,
voltage fault, or corrupt configuration.
Figure 38 Hardware status LEDs