
User Manual
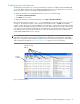


Table Of Contents
- Contents
- About this guide
- Using McDATA Web Server/Element Manager
- Managing Fabrics
- Securing a fabric
- Security consistency checklist
- Connection security
- User account security
- Remote authentication
- Device security
- Edit Security dialog
- Create Security Set dialog
- Create Security Group dialog
- Create Security Group Member dialog
- Editing the security configuration on a switch
- Viewing properties of a security set, group, or member
- Security Config dialog
- Archiving a security configuration to a file
- Activating a security set
- Deactivating a security set
- Configured Security data window
- Active Security data window
- Fabric services
- Rediscovering a fabric
- Displaying the event browser
- Working with device information and nicknames
- Zoning a fabric
- Zoning concepts
- Managing the zoning database
- Managing the active zone set
- Managing zones
- Merging fabrics and zoning
- Securing a fabric
- Managing switches
- Managing user accounts
- Configuring RADIUS servers
- Displaying switch information
- Configuring port threshold alarms
- Paging a switch
- Setting the date/time and enabling NTP client
- Resetting a switch
- Configuring a switch
- Archiving a switch
- Switch binding
- Restoring a switch
- Restoring the factory default configuration
- Downloading a support file
- Installing Product Feature Enablement keys
- Installing firmware
- Displaying hardware status
- Managing ports
- Glossary
- Index
32
Severity is indicated in the severity column using icons as described in Table 4.
NOTE: Events (Alarms, Critical, Warning, and Informative) generated by the web applet are not saved on
the switch. They are permanently discarded when you close a McDATA Web Server session, but you can
save these events to a file on the workstation before you close McDATA Web Server and read it later with
a text editor or browser.
Events generated by the switch are stored on the switch, and will be retrieved when the application is
restarted.
Sorting the event browser
Sorting the Event Browser enables you to display the events in alphanumeric order based on the event
severity, timestamp, source, type, or description. Initially, the Event Browser is sorted in ascending order by
timestamp. Successive sort operations of the same type alternate between ascending and descending
order. To sort the Event Browser, choose one of the following:
• Click the Severity, Timestamp, Source, Type, or Description columns.
• Select Sort > By Severity, By Timestamp, By Source, By Type, or By Description.
Table 4 Severity levels
Severity Icon Description
Alarm
— an alarm is a serviceable event. This means that attention by the user or field
service is required. Alarms are posted asynchronously to the screen and cannot be
turned off. If the alarm denotes that a system error has occurred the customer and/or
field representative will generally be directed to provide a support file for the switch.
Critical event
— an event that indicates a potential failure. Critical log messages are
events that warrant notice by the user. By default, these log messages will be posted to
the screen. Critical log messages do not have alarm status as they require no immediate
attention from a user or service representative.
Warning event
— an event that indicates errors or other conditions that may require
attention to maintain maximum performance. Warning messages will not be posted to
the screen unless the log is configured to do so. Warning messages are not disruptive
and, therefore, do not meet the criteria of Critical. The user need not be informed
asynchronously
No icon Informative
— an unclassified event that provides supporting information.