
User Manual
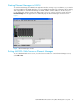
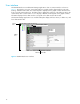


Table Of Contents
- Contents
- About this guide
- Using McDATA Web Server/Element Manager
- Managing Fabrics
- Securing a fabric
- Security consistency checklist
- Connection security
- User account security
- Remote authentication
- Device security
- Edit Security dialog
- Create Security Set dialog
- Create Security Group dialog
- Create Security Group Member dialog
- Editing the security configuration on a switch
- Viewing properties of a security set, group, or member
- Security Config dialog
- Archiving a security configuration to a file
- Activating a security set
- Deactivating a security set
- Configured Security data window
- Active Security data window
- Fabric services
- Rediscovering a fabric
- Displaying the event browser
- Working with device information and nicknames
- Zoning a fabric
- Zoning concepts
- Managing the zoning database
- Managing the active zone set
- Managing zones
- Merging fabrics and zoning
- Securing a fabric
- Managing switches
- Managing user accounts
- Configuring RADIUS servers
- Displaying switch information
- Configuring port threshold alarms
- Paging a switch
- Setting the date/time and enabling NTP client
- Resetting a switch
- Configuring a switch
- Archiving a switch
- Switch binding
- Restoring a switch
- Restoring the factory default configuration
- Downloading a support file
- Installing Product Feature Enablement keys
- Installing firmware
- Displaying hardware status
- Managing ports
- Glossary
- Index
McDATA® 4Gb SAN Switch for HP p-Class BladeSystem user guide 19
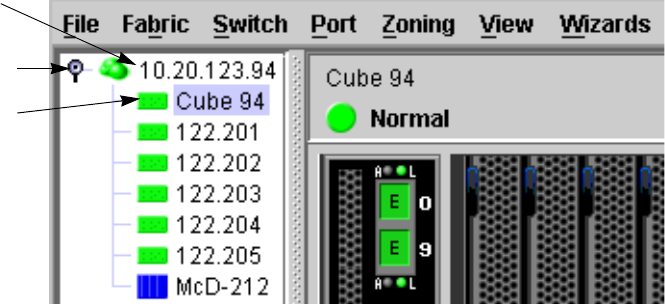
McDATA Web Server Fabric tree
McDATA Web Server enables you to manage McDATA 4Gb SAN Switches and observe other switches in
the fabric. The fabric tree, shown in Figure 4, provides access to the faceplate display of each McDATA
4Gb SAN Switch in the fabric, and displays the presence of other switches in the fabric. Click a switch
name or icon of a McDATA 4Gb SAN Switch to display that switch faceplate in the graphic window. The
window width of the fabric tree can be adjusted by clicking and dragging the moveable window border.
The fabric tree entry has a small icon next to it that uses color to indicate operational status.
• A green icon indicates normal operation.
• A yellow icon indicates that a switch is operational, but may require attention to maintain maximum
performance.
• A red icon indicates a potential failure or non-operational state as when the switch is offline.
• A blue icon indicates that a switch is unknown, unreachable, or unmanageable through the McDATA
4Gb SAN Switch.
If the status of the fabric is not normal, the fabric icon in the fabric tree will indicate the reason for the
abnormal status. The same message is provided when you rest the mouse on the fabric icon in the fabric
tree.
Figure 4 McDATA Web Server fabric tree
Graphic window
The graphic window shows the switch faceplate display. The window height can be adjusted by clicking
and dragging the window border that it shares with the data window.
Switch
entries
Entry handle
Fabric entry