
Operating Environment Software User guide
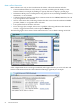


Table Of Contents
- HP Insight Virtualization Manager 6.0 Software with Logical Server Management: User Guide
- Table of Contents
- 1 Introduction
- 2 Getting started with Virtualization Manager
- 3 Working with logical servers
- Using logical servers in Virtualization Manager
- New features in logical servers
- Understanding logical servers as they appear in visualization perspectives
- Logical server operations
- Authorizations, requirements, and configuration
- Logical server requirements
- Configuring and registering VMware vCenter
- Configuring VMware vSphere client settings for browsing datastore
- Configuring HP SIM with Onboard Administrator credentials
- Configuring HP SIM for SAN storage validation
- Configuring Extensible Server & Storage Adapter (ESA)
- Configuring Storage Provisioning Manager (SPM)
- LSMUTIL database utility
- 4 Defining storage for logical servers
- 5 Troubleshooting
- Navigation tips
- User preferences tips
- Performance tips
- Problems with meters collecting data
- Search button displays error page
- Displaying empty, hidden resource pools
- Errors accessing single sign-on iLO or Onboard Administrator
- Recovery after logical server operation failures
- Troubleshooting an inoperable logical server
- Correcting problems powering on a logical server
- Logical server operations cannot be cancelled
- Logical Server Automation service fails to start if TCP layer ports are in use
- Use portable WWNs and MAC addresses for Virtual Connect domain groups
- Do not use valid host name as logical server name
- Oversubscribing the number of networks
- Insufficient NICs error when activating or moving logical servers (Virtual Connect Flex-10 support)
- Use caution when renaming or moving a Virtual Connect domain group
- Deactivate or move logical servers before replacing blade
- Unmanaging a logical server using a storage pool entry may result in an inconsistent state
- Synchronize clocks on the CMS, managed systems, and VMware vCenter
- Ensure VM Hosts use fully qualified host names
- VM Hosts must be in same vCenter for ESX virtual machine logical server moves
- VM displayed without association in Virtualization Manager perspectives after deactivation
- Moving logical servers when the CMS and vCenter are in different network domains
- Changing the IP address of a VM Host after logical server discovery prevents the VM Host from appearing as an activation and move target
- Creating and managing logical servers on Microsoft Windows Hyper-V Server 2008
- 6 Advanced features
- 7 Support and other resources
- Index

NOTE: Because power settings are associated with hardware, power meters do not display
for VM guests (including HP virtual machines, Microsoft virtual machines, or VMware),
complexes, enclosures, Virtual Connect Domains, and Virtual Connect Domain groups.
CPU, memory, network I/O, and disk I/O meter information is obtained via WBEM from the
Utilization Provider running on the managed systems, Virtual Machine Management, or other
sources depending on the physical or virtual system you are viewing. Power meter data is based
on CPU utilization; therefore, CPU utilization data needs to be present (in addition to the power
calibration) before power meters can be shown.
The Utilization Provider maintains a running average of the utilization metrics, updating the
information every 5 minutes. The average is calculated by comparing the current sample with
the sample of 5 minutes earlier, so two samples are required before utilization data is available.
This means that it can take up to 10 minutes from the time that the Utilization Provider begins
monitoring a system or workload before utilization data is available. Other sources of utilization
data have a similar interval for updating the data. During that interval, the utilization meters
are grayed out (Workload View) or have an hourglass icon on them (Visualization View).
The following information applies only to the meters in the Visualization Tab.
• If no data is available, dashes (- -) appear over the meter (for example, if a system is
disabled).
• Question mark icons appear when the utilization data can be collected, but is in an unknown
or unusable state.
• A yellow warning icon overlaying the blue meter data means that some or all of the data is
reliable, but some data might be unreliable. This transparent warning icon is displayed only
during agentless data collection, when hyperthreading is enabled on certain machines. The
meter popups display the warning message.
• HP SIM status icons can also appear in a meter indicating a status condition, such as a
problem collecting utilization data.
• A warning triangle indicates a problem with collection of the meter data and that details
can be found in the meter callout (see “Meter callout information” (page 94) for information
on meter callouts).
Accessing utilization data
You can access utilization data from the Visualization View and Workload View.
From the Visualization Tab
Click the Visualization tab to display the Visualization View (the default view when you first
access the Virtualization Manager). In a system compartment, hover over the meter callout icon
. This action displays callout information for the all available utilization metrics, including
any error conditions. From the callout information box (see “Meter callout information” (page 94)),
you can view more information, including real-time data and historical data. Click the link next
to the metric to display the Capacity Advisor Profile Viewer. For information on the Capacity
Advisor Profile Viewer, see the HP Insight Capacity Advisor 6.0 Software: User Guide.
From the Workload tab
Click the Workload tab to display the Workload View. The utilization metrics are displayed in
table rows on the main page. You can view data for any metric by clicking its meter or
corresponding percentage estimate, both of which displays the Capacity Advisor Profile Viewer.
If no data has been collected yet, you can use the Capacity Advisor to begin collecting data.
92 Advanced features