
Software Platform User guide


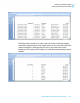
Table Of Contents
- Crystal Reports 2008 SP3 User's Guide
- Contents
- Introduction to Crystal Reports 2008
- What's New in Crystal Reports 2008 SP3
- Installing Crystal Reports 2008 SP3
- Installation overview
- Installing Crystal Reports 2008 SP3
- Installation requirements
- Installing Crystal Reports on a local machine
- Creating an installation point and installing from a network server
- Customizing your installation
- Running a silent installation
- Setting custom banners
- Upgrading Crystal Reports components
- Quick Start
- Learning how to use Crystal Reports
- Report Creation Wizards
- Quick start for new users
- Before you begin
- Creating the report
- Selecting a database to use
- Report sections
- Inserting a field
- Understanding fields
- Adding additional fields
- Selecting fields
- Resizing fields
- Reviewing your work
- Displaying field names
- Combining database fields in a text object
- Adding summary information
- Adding a title
- Formatting objects
- Adding a field heading
- Saving the report
- Record Selection
- Grouping and sorting
- Completing the report
- Quick start for advanced users
- Report Design Concepts
- Introduction to Reporting
- Report creation options
- Choosing data sources and database fields
- About the report design environment
- Creating a new report
- Selecting the data source
- Adding tables
- Linking multiple tables
- Placing data on the report
- Formatting data
- Record selection
- Grouping, sorting, and summarizing data
- Using the drill-down option on summarized data
- Using the zoom feature
- Inserting page headers and footers
- Adding a title page to the report
- Adding summary information to the report
- Exploring reports and working with multiple reports
- Beyond basic reports
- BusinessObjects Enterprise Repository
- What is the BusinessObjects Enterprise Repository?
- Accessing the BusinessObjects Enterprise Repository
- Adding subfolders and subcategories to the repository
- Adding items to the repository
- Using repository objects in reports
- Modifying objects in the repository
- Updating connected repository objects in reports
- Deleting items from the repository
- Using Undo in the repository
- Designing Optimized Web Reports
- Overview
- Scale with BusinessObjects Enterprise
- Making the right design choices
- Streamlining your reporting environment
- Using enhanced record selection formulas
- Improving grouping, sorting, and totaling
- Record Selection
- Selecting records
- Using formula templates
- Pushing down record selection to the database server
- Troubleshooting record selection formulas
- Sorting, Grouping, and Totaling
- Sorting data
- Grouping data
- Summarizing grouped data
- Subtotaling
- Percentages
- Group headers
- Running Totals
- Multiple Section Reports
- Formatting
- Formatting concepts
- Using a template
- Using the Report Design Environment
- Section characteristics
- Making an object underlay a following section
- Pre-printed forms
- Multiple columns
- Hiding report sections
- Hiding report objects
- Placing text-based objects
- Placing multi-line, text-based objects
- Importing text-based objects from a file
- Spacing between text-based objects
- Overflow Field Representation
- Selecting multiple objects
- Vertical placement
- Inserting character and line spacing
- Setting fractional font sizes
- Setting page size and page orientation
- Setting page margins
- TrueType fonts
- Printer drivers
- Formatting a report for web viewing
- Formatting properties
- Working with absolute formatting
- Adding borders, color, and shading to a field
- Making a report, section, area, or object read-only
- Locking an object's size and position
- Changing your default field formats
- Adding and editing lines
- Adding and editing boxes
- Expected behavior of line and box formatting
- Adding shapes to a report
- Scaling, cropping, and sizing objects
- Using conventional accounting formats
- Repeating report objects on horizontal pages
- Using white space between rows
- Working with conditional formatting
- Using the Format Painter
- Working with barcodes
- Charting
- Charting concepts
- Creating charts
- Working with charts
- Mapping
- Mapping concepts
- Creating maps
- Working with maps
- OLE
- OLE overview
- Inserting OLE objects into reports
- How OLE objects are represented in a report
- Editing OLE objects in reports
- Working with static OLE objects
- Working with embedded vs. linked objects
- Integrating Shockwave Flash (SWF) objects
- Cross-Tab Objects
- What is a Cross-Tab object?
- Cross-Tab example
- Creating a Cross-Tab report
- To create a new cross-tab report
- To add a Cross-Tab to an existing report
- Specifying the data source
- Modifying the links
- Adding a chart
- Selecting records
- Defining the structure of the Cross-Tab
- Applying a predefined style and finishing the report
- Adding a Cross-Tab to an existing report using the Cross-Tab Expert
- Working with Cross-Tabs
- Formatting Cross-Tabs
- Advanced Cross-Tab features
- Building Queries
- Connecting to a universe
- Defining the data selection for a query
- Editing an existing query
- Viewing the SQL behind a query
- Query filters and prompts
- Filtering data using subqueries and database ranking
- Creating and Updating OLAP Reports
- Printing, Exporting, and Viewing Reports
- Distributing reports
- Printing a report
- Faxing a report
- Exporting a report
- Working with Web folders
- Working with Enterprise folders
- Viewing reports
- Using smart tags
- Distributing reports
- Report Alerts
- Using Formulas
- Formulas overview
- Formula components and syntax
- User Function Libraries in formulas
- Specifying formulas
- Creating and modifying formulas
- Deleting formulas
- Debugging formulas
- Parameter Fields and Prompts
- Parameter and prompt overview
- Understanding dynamic prompts
- Understanding lists of values
- Creating a parameter with a static prompt
- Creating a parameter with a dynamic prompt
- Creating a parameter with a cascading list of values
- The Parameter Panel
- Working with lists of values
- Best practices for prompting
- Deleting parameter fields
- Responding to parameter field prompts
- Advanced parameter features
- Creating a parameter with multiple prompting values
- Applying conditional formatting using parameter fields
- Creating a report title using parameter fields
- Specifying single or ranges of values
- Incorporating a parameter into a formula
- Defining sort order using parameter fields
- Defining entry type and format using the Edit Mask
- Creating a saved-data record filter using parameter fields
- To create a saved-data record filter using parameter fields
- To create a parameter appearing on the Parameter Panel
- To incorporate the parameter into a saved data selection formula
- Adding dynamic grouping using parameter fields
- Subreports
- Understanding Databases
- Databases overview
- Linking tables
- Using SQL and SQL databases
- Server-side processing
- Mapping database fields
- Saved Data Indexes
- Unicode support in Crystal Reports
- For additional information
- Accessing Data Sources
- Introduction
- Direct access database files
- ODBC data sources
- JDBC data sources
- Business Objects universes
- Business Views
- Crystal SQL Designer files
- Crystal Dictionary files
- Report Processing Model
- Crystal Reports Error Messages
- Creating Accessible Reports
- More Information
- Index

Contrasting colors
Users with limited vision may be unable to distinguish between colors. To
test the color contrast in your report, print or view a black and white copy.
You should be able to distinguish between values or fields displayed in
different colors (in a pie chart, for example).
If you cannot distinguish between colors on the report, try different colors or
use gray shading. If this does not resolve the issue, you can change other
characteristics.
For text, use the Format Editor to change the font, size, or style. You can
add borders, underlining, or background shading to differentiate text objects
from each other.
For charts, use a combination of shading and patterns. You can automatically
convert a color chart to a black and white one using the Chart Expert, or you
can select values individually and choose your own patterns.
Using color to convey information
Do not use color as the only identifying characteristic for critical information
in a report.
For example, a text object may instruct users to "click the green button" to
open a subreport. Users with limited vision cannot tell which button is green.
The button should be recognizable by another defining characteristic besides
its color. For example, you can change the button graphic to a shape that is
not used elsewhere on the report, and instruct users to "click the green arrow
button". This solution provides color information for people who can
distinguish colors, and extra information for people who cannot.
Other common situations where color may be used to provide important
information include:
• Highlighting
To highlight particular values in a table, do not change only the color of
the value. If you highlight outstanding invoices in red, for example, they
may look the same as the paid invoices to someone with limited vision.
In the Highlighting Expert dialog box, change a font characteristic other
than color, such as font style.
Crystal Reports 2008 SP3 User's Guide 771
C
Creating Accessible Reports
Improving report accessibility