
Software Platform User guide
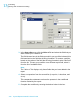
Table Of Contents
- Crystal Reports 2008 SP3 User's Guide
- Contents
- Introduction to Crystal Reports 2008
- What's New in Crystal Reports 2008 SP3
- Installing Crystal Reports 2008 SP3
- Installation overview
- Installing Crystal Reports 2008 SP3
- Installation requirements
- Installing Crystal Reports on a local machine
- Creating an installation point and installing from a network server
- Customizing your installation
- Running a silent installation
- Setting custom banners
- Upgrading Crystal Reports components
- Quick Start
- Learning how to use Crystal Reports
- Report Creation Wizards
- Quick start for new users
- Before you begin
- Creating the report
- Selecting a database to use
- Report sections
- Inserting a field
- Understanding fields
- Adding additional fields
- Selecting fields
- Resizing fields
- Reviewing your work
- Displaying field names
- Combining database fields in a text object
- Adding summary information
- Adding a title
- Formatting objects
- Adding a field heading
- Saving the report
- Record Selection
- Grouping and sorting
- Completing the report
- Quick start for advanced users
- Report Design Concepts
- Introduction to Reporting
- Report creation options
- Choosing data sources and database fields
- About the report design environment
- Creating a new report
- Selecting the data source
- Adding tables
- Linking multiple tables
- Placing data on the report
- Formatting data
- Record selection
- Grouping, sorting, and summarizing data
- Using the drill-down option on summarized data
- Using the zoom feature
- Inserting page headers and footers
- Adding a title page to the report
- Adding summary information to the report
- Exploring reports and working with multiple reports
- Beyond basic reports
- BusinessObjects Enterprise Repository
- What is the BusinessObjects Enterprise Repository?
- Accessing the BusinessObjects Enterprise Repository
- Adding subfolders and subcategories to the repository
- Adding items to the repository
- Using repository objects in reports
- Modifying objects in the repository
- Updating connected repository objects in reports
- Deleting items from the repository
- Using Undo in the repository
- Designing Optimized Web Reports
- Overview
- Scale with BusinessObjects Enterprise
- Making the right design choices
- Streamlining your reporting environment
- Using enhanced record selection formulas
- Improving grouping, sorting, and totaling
- Record Selection
- Selecting records
- Using formula templates
- Pushing down record selection to the database server
- Troubleshooting record selection formulas
- Sorting, Grouping, and Totaling
- Sorting data
- Grouping data
- Summarizing grouped data
- Subtotaling
- Percentages
- Group headers
- Running Totals
- Multiple Section Reports
- Formatting
- Formatting concepts
- Using a template
- Using the Report Design Environment
- Section characteristics
- Making an object underlay a following section
- Pre-printed forms
- Multiple columns
- Hiding report sections
- Hiding report objects
- Placing text-based objects
- Placing multi-line, text-based objects
- Importing text-based objects from a file
- Spacing between text-based objects
- Overflow Field Representation
- Selecting multiple objects
- Vertical placement
- Inserting character and line spacing
- Setting fractional font sizes
- Setting page size and page orientation
- Setting page margins
- TrueType fonts
- Printer drivers
- Formatting a report for web viewing
- Formatting properties
- Working with absolute formatting
- Adding borders, color, and shading to a field
- Making a report, section, area, or object read-only
- Locking an object's size and position
- Changing your default field formats
- Adding and editing lines
- Adding and editing boxes
- Expected behavior of line and box formatting
- Adding shapes to a report
- Scaling, cropping, and sizing objects
- Using conventional accounting formats
- Repeating report objects on horizontal pages
- Using white space between rows
- Working with conditional formatting
- Using the Format Painter
- Working with barcodes
- Charting
- Charting concepts
- Creating charts
- Working with charts
- Mapping
- Mapping concepts
- Creating maps
- Working with maps
- OLE
- OLE overview
- Inserting OLE objects into reports
- How OLE objects are represented in a report
- Editing OLE objects in reports
- Working with static OLE objects
- Working with embedded vs. linked objects
- Integrating Shockwave Flash (SWF) objects
- Cross-Tab Objects
- What is a Cross-Tab object?
- Cross-Tab example
- Creating a Cross-Tab report
- To create a new cross-tab report
- To add a Cross-Tab to an existing report
- Specifying the data source
- Modifying the links
- Adding a chart
- Selecting records
- Defining the structure of the Cross-Tab
- Applying a predefined style and finishing the report
- Adding a Cross-Tab to an existing report using the Cross-Tab Expert
- Working with Cross-Tabs
- Formatting Cross-Tabs
- Advanced Cross-Tab features
- Building Queries
- Connecting to a universe
- Defining the data selection for a query
- Editing an existing query
- Viewing the SQL behind a query
- Query filters and prompts
- Filtering data using subqueries and database ranking
- Creating and Updating OLAP Reports
- Printing, Exporting, and Viewing Reports
- Distributing reports
- Printing a report
- Faxing a report
- Exporting a report
- Working with Web folders
- Working with Enterprise folders
- Viewing reports
- Using smart tags
- Distributing reports
- Report Alerts
- Using Formulas
- Formulas overview
- Formula components and syntax
- User Function Libraries in formulas
- Specifying formulas
- Creating and modifying formulas
- Deleting formulas
- Debugging formulas
- Parameter Fields and Prompts
- Parameter and prompt overview
- Understanding dynamic prompts
- Understanding lists of values
- Creating a parameter with a static prompt
- Creating a parameter with a dynamic prompt
- Creating a parameter with a cascading list of values
- The Parameter Panel
- Working with lists of values
- Best practices for prompting
- Deleting parameter fields
- Responding to parameter field prompts
- Advanced parameter features
- Creating a parameter with multiple prompting values
- Applying conditional formatting using parameter fields
- Creating a report title using parameter fields
- Specifying single or ranges of values
- Incorporating a parameter into a formula
- Defining sort order using parameter fields
- Defining entry type and format using the Edit Mask
- Creating a saved-data record filter using parameter fields
- To create a saved-data record filter using parameter fields
- To create a parameter appearing on the Parameter Panel
- To incorporate the parameter into a saved data selection formula
- Adding dynamic grouping using parameter fields
- Subreports
- Understanding Databases
- Databases overview
- Linking tables
- Using SQL and SQL databases
- Server-side processing
- Mapping database fields
- Saved Data Indexes
- Unicode support in Crystal Reports
- For additional information
- Accessing Data Sources
- Introduction
- Direct access database files
- ODBC data sources
- JDBC data sources
- Business Objects universes
- Business Views
- Crystal SQL Designer files
- Crystal Dictionary files
- Report Processing Model
- Crystal Reports Error Messages
- Creating Accessible Reports
- More Information
- Index

Note:
If the field selected in the "Value of" list is not numeric, the text box turns
into a list of available values, from which you must select one.
6. In the Font style, Font color, Background, and Border lists, specify
the formatting changes that you want to apply to the selected field when
your condition is met.
7. Repeat steps 3 and 4 if you want to apply multiple highlighting conditions
to the selected field.
Note:
You can use the expert's Remove button to delete highlighting formulas
from the list.
8. Use the Priority arrows to specify the order in which you want Crystal
Reports to apply your conditions. For details, see Setting highlighting
priorities.
9. Click OK to return to your report.
Setting highlighting priorities
The Priority buttons in the Item list area of the Highlighting Expert allow you
to set priorities for your formulas. This is useful when you have two or more
formulas that could offer conflicting results in some situations.
For example, suppose that you highlight the Unit Price field on the report.
You assign to this field a highlighting formula that shows a yellow background
when a unit price is greater than $100. Then, on this same report, you create
another highlighting formula that shows a red background when a unit price
is greater than $200. Considering that 100 is a subset of 200, you could have
Unit Price fields with yellow backgrounds when, in fact, those fields should
have red backgrounds. In other words, a unit price of $300 could receive
either a red or a yellow background, depending on which formula has been
assigned priority.
To set priorities for highlighting formulas
1. On the Format menu, click Highlighting Expert.
2. In the Item list area, select one of the conditional highlighting formulas
that you have created.
3. Click the Priority arrows to move the selected formula to a position above
or below the other formula(s).
Crystal Reports 2008 SP3 User's Guide 359
13
Formatting
Working with conditional formatting