HP NonStop RPM Real-time Process Monitor User’s Guide Abstract HP NonStop™ Real-time Process Monitor (RPM) is a high-performance, low-overhead, Cpu and Process monitoring utility engineered for NonStop servers. RPM continuously discovers "busy" Cpus/Processes, and sorts, prioritizes, color-encodes, displays real-time resource statistics by Cpu, by Node, or across a whole cluster of nodes. Beginning with RPM release 1.
Document History Part Number Product Version Published 545801-001 V01 April 2008 545801-002 V01 July 2008 545801-003 V01 March 2010 HP NonStop RPM User’s Guide Page 2 of 52
Table of Contents HP NonStop RPM Real-time Process Monitor User’s Guide ................................................ 1 Table of Contents ...................................................................................................................... 3 What’s New in This Manual ....................................................................................................... 4 New and Changed Information ..........................................................................................
What’s New in This Manual New and Changed Information 545801-003 - March 2010 New Enhancements The RPM 1.2 version of this manual contains the following enhancements: Added RPM Performance section explaining how RPM release 1.2 REDUCED CPU overhead by 10-20x and REDUCED messaging overhead by 100x. Added new Process Busy BY item analysis features: ByBusy, ByMemory, ByInputs, ByIOs, ByOutputs, ByPFS, ByRcvQ, and BySwaps to the PB command.
About This Manual Audience The intended audience for this document is system managers, administrators, and developers responsible for maintaining and monitoring HP NonStop Servers. Related Documents None Manual Organization Section Description Overview Overview and architecture of the HP NonStop RPM product. Installing NonStop RPM Procedures for installing the NonStop HP NonStop RPM product. Configuring RPM Procedures for configuring and managing the NonStop RPM product.
UPPERCASE LETTERS Uppercase letters indicate keywords and reserved words. Type these items exactly as shown. Items not enclosed in brackets are required. For example: MAXATTACH lowercase italic letters Lowercase italic letters indicate variable items that you supply. Items not enclosed in brackets are required. For example: file-name computer type Computer type letters within text indicate C and Open System Services (OSS) keywords and reserved words. Type these items exactly as shown.
{ } Braces A group of items enclosed in braces is a list from which you are required to choose one item. The items in the list can be arranged either vertically, with aligned braces on each side of the list, or horizontally, enclosed in a pair of braces and separated by vertical lines. For example: LISTOPENS PROCESS { $appl-mgr-name } { $process-name } ALLOWSU { ON | OFF } | Vertical Line A vertical line separates alternatives in a horizontal list that is enclosed in brackets or braces.
Item Spacing Spaces shown between items are required unless one of the items is a punctuation symbol such as a parenthesis or a comma. For example: CALL STEPMOM ( process-id ) ; If there is no space between two items, spaces are not permitted. In this example, no spaces are permitted between the period and any other items: $process-name.
!o:i In procedure calls, the !o:i notation follows an output buffer parameter that has a corresponding input parameter specifying the maximum length of the output buffer in bytes. For example: error := FILE_GETINFO_ ( filenum , [ filename:maxlen ] ) ; !i !o:i Notation for Messages This list summarizes the notation conventions for the presentation of displayed messages in this manual. Bold Text Bold text in an example indicates user input typed at the terminal.
either vertically, with aligned brackets on each side of the list, or horizontally, enclosed in a pair of brackets and separated by vertical lines. For example: proc-name trapped [ in SQL | in SQL file system ] { } Braces A group of items enclosed in braces is a list of all possible items that can be displayed, of which one is actually displayed.
UPPERCASE LETTERS Uppercase letters indicate names from definition files. Type these names exactly as shown. For example: ZCOM-TKN-SUBJ-SERV lowercase letters Words in lowercase letters are words that are part of the notation, including Data Definition Language (DDL) keywords. For example: token-type !r The !r notation following a token or field name indicates that the token or field is required. For example: ZCOM-TKN-OBJNAME token-type ZSPI-TYP-STRING.
1. Overview 1.1. Introduction NonStop Real-time Process Monitor (RPM) is a software utility for NonStop servers that displays the busiest Cpus and processes by Cpu, or by node, or across a cluster of Expand nodes. 1.2. Features NonStop RPM provides a wide-range of features across a wide-range of device types. In all cases, features are equivalent on all supported devices.
Applicability RPM is a universally applicable operations tool for NonStop servers. It is designed to do one thing very well, that is real-time monitoring, discovery, and display of the busiest Cpus and processes executing in one or more NonStop servers. The RPM product can be used by a wide-range of systems, devices, and operations personnel.
RPM capabilities are nearly equivalent between device types. In all cases RPM has the ability to quickly discover and display real-time Cpu and Process statistics. Because all RPM features are available on all supported device types, you have a great deal of flexibility in how you choose to configure RPM within your network. Thus it is up to you to decide which configuration makes the most sense for your particular environment.
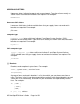
Example #1 - RPM monitoring a single Cpu In the example below, a process busy (PB) command is used to monitor one Cpu, Cpu 3 in this example, on the local node. It displays the 10 busiest processes (ENTRIES 10), updating every 5 seconds (RATE 5): TACL 1 > RPM PB 3, ENTRIES 10, RATE 5 Process Cpu,Pin Busy% Name -------- ------- ----- -------\A 3,73 87.82 $STEP 11:32:10 3,320 .30 $QAZ08 3,263 .20 $HIT 3,319 .15 $QAZ07 3,314 .12 $QAZ06 3,175 .09 $ZOOH3 3,0 .06 $MON 3,192 .04 $X11W 3,43 .02 $ZOOM3 3,312 .
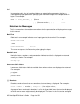
Example #3 - RPM monitoring all processes on one remote node Below a process busy (PB) command is used to monitor all processes in on all Cpus in a remote node, display the 10 busiest processes (ENTRIES 10), and update every 5 seconds (RATE 5): TACL 1 > RPM PB \B, ENTRIES 10, RATE 5 Process Cpu,Pin Busy% Name -------- ------- ----- -------\B 3,73 98.24 $STEP 11:59:05 0,41 1.25 $ZEXP 1,159 .82 $Y7Q6 1,69 .70 $ZOOB 2,271 .58 $HIT 2,279 .52 $HIT 2,28 .38 $X90N 1,153 .31 $X11Z 3,263 .31 $HIT 0,0 .
1.4 Performance RPM was designed to provide a fast lightweight means of determining the busiest processes and processors in collections of NonStop servers. Additionally unlike some performance monitors, RPM monitors processes without requiring any disk I/O at all. The result is that RPM has extremely low-overhead and very low-response-time at start-up.
2 Installing NonStop RPM This section provides an explanation of the steps required to install and run RPM on your system(s). Please read the other sections before fully deploying RPM in your environment. RPM configuration and installation are greatly simplified through the use of the RPM wizard named RPMWIZ. Once you become a proficient RPM user, you will not need the wizard to run RPM, but you will always benefit from the RPM Wizard to create config files and install RPM.
2.2 Wizard - CONFIG - Example CONFIG | SAVE | INSTALL | RUN | EXIT > CONFIG ------------------------------------------------------------------------------- Specify RPM device TYPE ? -----------------------------------------------------------------------------VT100 - Builds RpmVTCNF config file used by the RPMVT (VT100) object file. VT100 support is always present for Windows or Linux OS.
------------------------------------------------------------------------------- Specify the REPORT that you want: PROCESS, CPU, or ZOOM report ? -----------------------------------------------------------------------------RPM can display different real-time REPORTs.
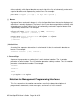
RPM can color highlight CPU and PROCESS objects with %busy values over three different threshold values. These color alert values are called: INFO - Busy% threshold value for informative alert (BLUE on VT100 devices) 1% is the default value for this alert. WARN - Busy% threshold value for warning alert (YELLOW on VT100 devices) 10% is the default value for this alert. CRIT - Busy% threshold value for critical alert (RED on VT100 devices) 50% is the default value for this alert.
2.3 Wizard - INSTALL - CONFIG | SAVE | INSTALL | RUN | EXIT > INSTALL Confirm RPM Source Distribution Volume (DSV) = $DATA.RPMV1 Y/N ? Y ===================================================================== RPM INSTALL started: 08/02/22 07:41:28 ===================================================================== 07:41:28 -------------> INSTALL \CHICAGO <------------FUP DUP $DATA.RPMV1.RPM , \CHICAGO.$SYSTEM.SYSTEM.RPM , purge,sourcedate FUP DUP $DATA.RPMV1.RPM , \CHICAGO.$SYSTEM.SYSTEM.
2.4 Wizard - RUN - Example CONFIG | SAVE | INSTALL | RUN | EXIT > RUN RUN $SYSTEM.SYSTEM.RPM Realtime Process Monitor(RPM) - T0877V01.00 - (20FEB08) Evaluation expires 2008/04/01 - comments - support@NonstopRPM.com OBEY DATA.USER.
CONFIG | SAVE | INSTALL | RUN | EXIT > NOTE - If you RUN RPM via the RPM Wizard, then after you EXIT RPM, and you are still in RPMWIZ, you can then repeatedly enter CONFIG, SAVE, or RUN again to alter your *CNF file(s) and experiment with RPM configurations and settings.
3 Configuring RPM When any RPM program object is executed (RPM, RPMVT, RPM65, or RPMXX) the RPM program searches for a configuration file whose name is the concatenation of the RPM object file name and the suffix string "CNF". For example, if you run RPM, the program object searches for a config file named RPMCNF. The search first occurs in the default subvolume, and if the *CNF file is not found in the default subvolume, then the $SYSTEM.SYSTEM subvolume is searched.
3.3 Config file examples The configuration files below provide examples of different types of configurations that can be generated using the RPM Wizard. The following documents configuration file contents, this is primarily for instructive purposes only, since generally you should use RPM Wizard RPMWIZ to create your configuration files. To run the RPM configuration wizard RPMWIZ enter the following command.
RPMCNF - T6530 Configuration file Example #2 The example below ADDs 3 nodes \Chicago, \Newyork, \Sanfran; sets the TERM type to T6530, indicates the 7 busiest processes should be displayed for each node (ENTRIES 7), sets SORT to be BYNODE, sets critical, warn, and info thresholds, sets the RATE to 10 seconds, and executes a PB \* Process Busy report that updates every 10 seconds.
RPMCNF - VT100 Configuration file Example #3 The example below ADDs 3 nodes \Chicago, \Newyork, \Sanfran sets the TERM type to VT100 , indicates the 10 busiest processes should be displayed for each node (ENTRIES 10), sets SORT to be BYNODE, sets critical, warn, and info thresholds, sets RATE to 10 seconds, executes a ZOOM \* command which displays a combined Cpu + PB report that updates every 10 seconds.
4 Running RPM This section describes how to run RPM on supported device types – TTY, T6530, VT100. Since there are generally multiple mechanisms and multiple config files for starting and configuring RPM on any given system, it is important to have a basic understanding of how each mechanism works. This section provides examples of how different RPM object files and configuration files interact. 4.1 Starting RPM in TTY mode To run RPM in TTY mode enter RPM from a TACL prompt.
SET SET SET SET SET PB SORT CRIT WARN INFO RATE \* BYNODE 50 10 1 10 ! ! ! ! ! ! sort across all cpus in each node set Critical alert busy threshold 50% set Warning alert busy threshold 10% set Info alert busy threshold 1% set refresh rate in seconds show Process Busy every 10 sec Note that the last command in the RPM65CNF file is a display command, so whenever you enter RPM65, it will automatically pickup all the SET options in the CNF file, and then will go into display mode displaying PB \* output.
5 RPM Commands RPM includes a command interpreter (CI) that can communicate with either a local copy of RPM or with any number of remote node copies of RPM. 5.1 Overview Enter HELP from any RPM prompt to display the following summary of commands... REALTIME PROCESS MONITOR (RPM) - T0877V01.00 - (15APR08) CPU PB ZOOM ADD EXIT FC HELP HISTORY NODES OBEY PAUSE RUN SET STATUS SYSTEM T6530 VOLUME VT100 ----- Monitoring commands ----Display realtime CPU statistics.
RPM Commands and abbreviations Abbreviation A or ADD C or CPU H or HELP P or PB S or SET ST or STATUS T6 or T6530 V or VT100 Z or ZOOM 5.
5.3 CPU Command CPU | C [ \* | \SYSNAME ] [ [ [ [ [ [ [ [ [ BUSY | % DETAIL | NORMAL ETALL [ DATE ] LAST MEMORY | MB | PCT NOCLEAR RATE TAB VT100 | T6530 | TTY ] ] ] ] ] ] ] ] ] The C or CPU command displays real-time CPU statistics for one or nodes. BUSY | % specifies the Cpu Busy threshold required for a Cpu to be displayed. Cpus busy must be greater than or equal to the specified in order to be displayed. Cpus with a busy value less than are not displayed.
interval unless LAST is specified. Note the default value of RATE is controlled by SET RATE . TAB outputs "09" tab characters between output columns. VT100 | T6530 | TTY - sets terminal type. Note the SET CRIT, WARN, INFO controls thresholds and the display of color-coded alerts. See HELP SET for more info.
EXAMPLES CPU \* C\* C RATE 6 C MEM C MB C PCT C\* %1 5.4 ! ! ! ! ! ! ! show same show show show show show all Cpus in super-cluster as CPU \* Cpu stats, repeat every 6 seconds Cpu Memory stats in pages Cpu Memory stats in megabytes Cpu Memory stats utilization Cpus greater than or equal to 1% busy HISTORY Command HISTORY [ ] FC [ | ] ! [ | ] The HISTORY command or just HI lists the history of commands you have entered.
5.5 PB Command PB | P [ [ [ [ [ [ [ [ [ [ [ [ [ [ [ [ \* | * | ] BUSY | % ] BYCPU | BYNODE ] BYBUSY | BYMEM | BYIN | BYIO | BYOUT | BYQ | BYPFS | BYSWAP ] DETAIL ] ENTRIES ] ET | ETALL | ETPCT [ DATE ] ] LAST ] NORMAL ] RATE ] RAW ] SAME ] SYNC ] TAB ] USECS ] VT100 | T6530 | TTY ] The P or PB command displays processes with the highest "busy" percentage. Process selection and "busy" percentage are a function of ByBusy | ... options explained below.
BYCPU | BYNODE - controls the display order of the top busiest processes. BYCPU displays the busiest processes in each Cpu grouped by Cpu number. BYNODE displays the busiest processes across all Cpus in each node grouped in one list of processes sorted from busiest to least busy process. If you do not specify this option, the busiest processes are listed ByNode, unless you specify SET SORT ByCPU. NOTE users can globally set sort order by using the SET SORT option.
Note: in conjunction with new BY items discussed above, RPM has SET MAX.. options that correspond to each rate/second BY item above. These SET MAX... values allow user control of normalization values so that displays can be tuned to system and application performance characteristics of a particular environment. DETAIL - displays additional stats such as node name, priority, accessorid, receive queue length, and memory pages in use.
RATE - causes stats display to repeat every . If RATE is zero, the display is updated once, with rates and busy calculations based on 1 second sample interval, unless LAST is specified. Note the default value of RATE is controlled by the SET RATE option. Note RATE can be abbreviated and without spaces, thus P\*R5 is allowed. SAME - displays the same stats as the prior PB command, but for different or with different DETAIL.
5.6 NODES Command NODES The N or NODES command displays the list of ADD \ that have been added to RPM. These nodes are the nodes that will have real-time CPU and Process Busy statistics analysis performed whenever \* appears in the CPU, PB, or ZOOM command.
5.
ENTRIES controls the default value of the ENTRIES option for the PB command. SET MAXINPUTS | MAXIOS | MAXOUTPUTS | MAXRCVQ | MAXSWAPS sets the normalization value for respective PB command BY... options. The is used with the PB command BY... options to determine the respective BY option percentage normalization. The following is an explanation of each MAX.. option...
the CPU and PB commands. Note this value can be gloabally changed with the SET RATE option. You can override the default value without changing the default by specifying RATE on the CPU or PB command. Note that although short sample intervals such as 1 or 2 seconds cause the screen to update frequently and these fast sample times are supported by RPM, a one second update is not necessarily the best setting.
5.8 STATUS Command STATUS [ SSG | [\].$ ] The STATUS command displays the status of SeeView Server Gateway (SSG) processes on the ADD nodes, or for a given $PID. EXAMPLES STATUS STATUS SSG STATUS $ZSCX 5.9 ! show status of all SSG's on all ADD nodes ! same as STATUS ! show status of pid $ZSCX T6530 Command T6530 The T6530 command is equivalent to entering SET TERM T6530. You can put commands in
5.10 VT100 Command VT100 VT100 terminal support is present in nearly all Windows, Linux, and Unix devices.
5.11 ZOOM Command ZOOM | Z [ \* | \sysname ] [ ] [ ] The ZOOM command provides a blended display of both Cpu and Process statistics. See the CPU and PB commands for applicable options.
A. Examples Appendices These appendices provide explanations of real-world examples of RPM output using various commands and options discussed in this manual. B. P \* ByPFS In the example below process statistics are displayed BY those processes that are consuming the highest percentage of the maximum Process File Segment (PFS) space available. In the case below note that process $Z447 is using an unusually high percentage of its PFS. This is because process $Z447 is "leaking" file opens.
C. P \* ByMemory In the example below process statistics are displayed BY processes consuming the most memory. In this case processes using the most memory include: Disk processes - \Chicago.$SYSTEM and \Chicago.$M03 Spooler Supervisor - \Chicago.
D. P \* ByRcvQ In the example below process statistics are displayed BY processes with the longest $Receive Queue. In this case processes with the longest receive queue include: Telserv services - \Chicago.$COSW and \Chicago.$COSV Q server processes - \Newyork.$Q50, \Newyork.$Q10, $Q6, $Q5 Tape Catalog Mgmt process - \Sanfran.
E. P \* ByInputs In the example below process statistics are displayed BY processes with the highest number of messages received per second. In this case processes with the highest number of messages received include: Disk processes - \Chicago.$SYSTEM, \Chicago.$VENUS (primary and backup) System Monitor processes - \Newyork.$MON Cpu 0, \Newyork.
F. P \* ByOutputs In the example below process statistics are displayed BY processes with the highest number of messages sent per second. In this case processes with the highest number of messages sent include: Network Control Process - \Chicago.$NCP Q Server Processes - \Newyork.$Q50 and \Newyork.
G. Z \* ByBusy In the example below the ZOOM command provides a blended display of both CPU and PROCESS statistics sorted BY processes consuming the highest percentage of CPU cycles. In this case processes with the highest CPU usage include: Processes - \Chicago.$SAW and \Chicago.$STEP in \Chicago Cpus 3 and 1 respectively explain why CPUs 1 and 3 in the CPU report are highlighted in red. Processes - \Sanfran.$MON, $SQP, $SPLS, $ZNES, ...