WVP Event Analyzer Plug-in User Guide Version 1.0 Part Number 536989-001 Abstract This manual describes the installation, configuration, and usage of Web Viewpoint (WVP) Event Analyzer Plug-in Software Version H01 on a HP NonStop™ system. Supported Release Version Updates (RVU’s) This publication supports J06.03 and all subsequent J-series RVUs, and H06.10 and all subsequent Hseries RVUs, until otherwise indicated by a replacement publication.
Introduction Table of Contents Version 1.0 ........................................................................................................................................................... 1 Part Number............................................................................................................................................. 1 Abstract...................................................................................................................................................
Introduction 2-2-7-3 Considerations............................................................................................................................ 32 2-2-8 Installing Event Analyzer EMS Template ............................................................................................ 32 2-3 Configuration Options .................................................................................................................................. 34 2-3-1 Overview..................................
Introduction 4-13 Alerts .......................................................................................................................................................... 73 4-13-1 Overview............................................................................................................................................ 73 4-13-2 Description.........................................................................................................................................
Introduction Figure 36 Month Drilldown – Daily ............................................................................................................................. 52 Figure 37 Daily – Tooltip ............................................................................................................................................ 53 Figure 38 Daily – Drilldown Options...........................................................................................................................
Introduction 1 Introduction Event Analyzer (EA) is a plug-in to Web ViewPoint (WVP) and provides comprehensive monitoring and analysis of EMS event activity on hp NonStop servers. This guide explains how to install, configure and use EA. The guide contents provide an overview of the product which includes the architecture, functional description, and user interface (UI) components. The overview section is followed by details on the installation which includes requirements, licensing, and configuration.
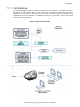
Introduction 1-1-1 Architecture The following diagram reflects the high-level architecture of the product. The EA processing is handled by the EA Collector process and is based on user defined configuration and control information. The UI process (EA View process) provides an Admin function to maintain the EA configuration and several control files. In addition, the UI process also displays to the user the trend charts and statistics requested.
Introduction Processing & DB Creation A scheduled Collector process runs 24*7 and reads the various event logs and creates the hourly, daily and monthly detail entries as well as records action event statistics. The Collector process is a NonStop process (i.e. check-pointed) that can be set to run as a low priority background process.
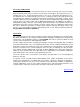
Introduction 1-1-2 Functional Overview EA modules enable the following functions: 1. Scanning EMS logs and creating databases. 2. Display of grids and charts showing event count statistics. 3. Display of grids and charts showing action event statistics. 4. Providing an interface that allows modification of the various configuration files. The figure below shows how the two modules, EACOLL and EAVIEW, interact with the Enscribe files, WVP and the EMS logs on NonStop.
Introduction 1. Scanning EMS logs and creating databases (Module: EACOLL): A NonStop process pair (program EACOLL) scans EMS logs once daily and updates the hourly, daily and monthly databases. The collectors looked at can be set via the ‘EA Admin’ interface accessible from the ‘Admin’ menu of WVP. The log file scan takes place at the hour and minute specified at the time of installation, which can be modified via the ‘EA Admin’ interface.
Introduction 1-1-3 User Interface EA is a plug-in to WVP and as such its look and feel is consistent with other recent plug-ins such as Storage Analyzer. 1-1-3-1 Overview To access the EA plug-in, go to the ‘Operations’ menu item in WVP and select ‘Event Analyzer’ from the drop down list. The main screen is a yearly grid showing the event numbers for the most recent year.
Introduction 1-1-3-2 Toolbars The following toolbar shows at the top left corner of all screens in EA. It is a selection window for choosing the scope of the data, i.e. the Owner-Subsystem-Event # or the Application. Clicking on the toolbar brings up a small popup that allows selection of the criteria mentioned. Default selection is All Owners, All Subsystems and All Events. Once an owner is changed from the dropdown, the subsystem list refreshes to show the subsystems available for the chosen owner.
Introduction In addition to the above buttons/icons, there can be other selection options on the toolbar depending on the type of screen. These options allow easy navigation to another point in time. E.g. a date selection field and hour, year, month or weekday dropdowns, as shown below: Figure 6 Toolbar Selection Options 1-1-3-3 Administration The EA Administration is done through the ‘EA Admin’ screen.
Introduction Exclusions: This screen allows adding one or more owner-subsystem combinations to the exclusion list. Once added to this list, the events for these owner-subsystems will not be looked at when analyzing EMS activity. For details on this screen refer to section 3-1-2-5. Alerts: EA allows setting thresholds on the number of events generated by owner-subsystems per hour and per day. This is done through the Alert Definition screen.
Introduction 1-2 Install Process Overview 1-2-1 General There are three ways to install the product: Wizard Installation, Manual Installation and IPSETUP. a) Wizard Installation is the recommended install process; see section 2-2-5 for details. Wizard Installation will guide you through each step of the process allowing you to set parameters as you move from one step to the next. b) For manual installation please refer to section 2-2-6.
Installation and Configuration 2 Installation and Configuration Installation of EA can be done either using the Wizard Installation, Manual Installation or IPSETUP. The Wizard Installation automates most of the install steps but requires Java Run Time on the PC where the installer is run. Configuration data is collected through user input and then the particular configuration files of WVP are updated and pushed to the NonStop server. This process greatly simplifies and streamlines the EA install process.
Installation and Configuration EA uses popups. This may cause EA to not work where the browser or antivirus utilities have popup blockers. Internet Explorer (IE) is the only browser currently supported by Web ViewPoint. 2-1-1-5 Monitor Settings The compatible screen resolution range for EA is Lowest : 1024 by 768 Highest: 1280 by 1024 If the resolution is made any lower than the specified value some screens might overflow the monitor area.
Installation and Configuration 2-2 Installation Details There are 3 different ways to install EA namely: EAInstall.exe: The PC–based wizard installer for EA. (Recommended process) Manual Installation: Use this option if the wizard installation fails. For e.g. if Java Run Time cannot be installed on the PC. IPSetup.exe : The IPSetup(DSM/SCM) installer for EA. 2-2-1 Install Basics 2-2-1-1 Overview EA only consists of one host component.
Installation and Configuration Table 1 Command & Obey Files - NonStop File Name Type/Code RWEP Description EABAMIMP 101 NUNU Obey file to import EA BAM entries to Web Viewpoint BAM MAKEWEA 101 NUNU Obey Script to create key sequenced files and set file codes and permissions INSTWEA 101 NUNU Obey Script to launch the manual installation process 2-2-2-2 Configuration Files The configuration for EA is appended to the configuration files of Web ViewPoint: STRTWVP, STOPWVP, WVPCONF and WVPMENU.
Installation and Configuration 2-2-3 File List - Windows Client EA’s windows client file only comprises of the install package. 2-2-3-1 Object & Executable Files Table 3 Object & Executable Files – Windows Client File Name Type/Code Location Description EAInstall Exe Wizard Installer User specified [Back to TOC] 2-2-4 Configuration Defaults/Initial Settings 2-2-4-1 For WVP’s PROCMAN Object PROCMAN object is the process manager that creates and manages the EAVIEW process.
Installation and Configuration EA collector backup CPU: PARAM EACOLL-BACKUP-CPU [STRTWVP] This is the CPU where the backup process for the EACOLL program will be started. If omitted, or if an invalid value is specified, the backup CPU is determined by the system. Default value 1 Minimum value 0 Maximum value Max.
Installation and Configuration Web ViewPoint ACK Priority over action-taken event?: This flag decides whether an action-required event acknowledged via Web ViewPoint takes priority if the same event also matches up with an action-taken event. Location is the ENSCRIBE file EAPARAM (modifiable through EA Admin Configuration Screen). Default value YES Note: When acknowledge from the Web ViewPoint Lite port, it is required to run Web ViewPoint Lite with the LITEAUTH param (in LITECONF file) to be set to YES.
Installation and Configuration 2-2-5 Wizard Install EA comes with a powerful, flexible and smart PC-based installer. The PC based installer provides a comprehensive wizard that guides the user through the install process. Install options provide paths for single-node as well as multi-node installations. 2-2-5-1 Overview The Wizard builds all of the NonStop configuration files on the PC, then automatically FTPs the files to the NonStop and starts up EA.
Installation and Configuration 2-2-5-2 Process a. Double click on the EAInstall.exe file. It is a self extracting executable that asks the user to extract the contents to a folder on the PC. The folder defaults to “C:\Program Files\Hewlett Packard\Web ViewPoint\Event Analyzer Plug-in Installer\” but this can be changed as needed. Once extracted, the installer is launched. A batch file is run first that checks whether the required Java version exists on the PC.
Installation and Configuration Figure 9 Wizard Installation – Single-node configuration Alternately, if you are installing EA on multiple nodes, you can choose the ‘Multi-node’ option. This screen will accept address of multiple nodes/residents. While a single set of WVP and EA locations are to be entered at the bottom, you will get a chance to review these again before beginning the installation for each node separately: Figure 10 Wizard Installation – Multi-node configuration d.
Installation and Configuration Figure 11 Wizard Installation – Event Analyzer Parameters e. Once the configuration is entered, the logon screen shows up. This screen prompts you to enter the userid and password to log on to the node/resident. Also, the configuration entered in the previous screens is listed here and can be modified if necessary.
Installation and Configuration Figure 12 Wizard Installation – Logon Screen f. The installation process consists of 24 steps in all.
Installation and Configuration Figure 13 Wizard Installation – Installation Progress g. The Wizard prompts you for more information through the following screens. This includes a confirmation for the names of the Web ViewPoint configuration files and the TCPIP program name (required to verify if the port specified is available): Figure 14 Wizard Installation –Configuration files & TCPIP Program Name h.
Installation and Configuration Figure 15 Wizard Installation – File Transfer i. Once the files have been transferred, WVP and its plug-ins are started up by OBEYing the Web ViewPoint startup file (STRTWVP): Figure 16 Wizard Installation – Starting Processes j. If the installation is successful, the following screen shows up. If an error occurs during any step of the process, the same screen shows with details of the error: Figure 17 Wizard Installation – Installation Status k.
Installation and Configuration Figure 18 Wizard Installation – Launch Option 2-2-5-3 Considerations Java Requirement: The PC based installer is a Java based program. Make sure Java is installed on the PC being used for the install before launching this installation wizard. The installer is compatible with JRE 1.5.0_12 and later.
Installation and Configuration 2-2-6 Manual Install In situations where the Wizard Install is not possible users also have an option to perform the installation manually. 2-2-6-1 Overview For performing manual installation, the user will need to FTP files manually and follow the installation procedure described below. Note that this is not our recommended process of installation.
Installation and Configuration 2-2-7 IPSETUP Option (DSM/SCM) EA can be installed using the DSM/SCM tool. 2-2-7-1 Overview EA is packaged on a CD as an independent product. To install it on a NonStop server, proceed as shown in the following section using the product CD: 2-2-7-2 Process a. Run the IPSetup program to begin installation, and follow the on-screen prompts to copy the files to the NonStop system. b. Files mentioned in the manual install section are placed into the product Subvolume. c.
Installation and Configuration d) Volume to $SYSTEM.ZTEMPL. This is the subvolume where the individual product templates are located. e) Move the new EA template file (ZWEATMPL) from the sub volume where EA is installed. For example, if you installed the EA software on $SYSTEM.ZWVPEA, then enter the following command. f) > FUP DUP $SYSTEM.ZWVPEA.ZWEATMPL, *, PURGE, SAVEALL g) Determine the names and location of your current resident and non-resident template files using the following command.
Installation and Configuration 2-3 Configuration Options This section goes over the configuration options for EA. 2-3-1 Overview The configuration for EA is spread over Web ViewPoint configuration files (STRTWVP & WVPCONF) as well as ENSCRIBE files that are modified via the EA Admin interface. 2-3-2 Configuration Options in Web ViewPoint configuration files This section lists the configuration params/assigns that exist in the Web ViewPoint configuration files WVPCONF and STRTWVP.
Installation and Configuration 2-3-3 Configuration Options in Event Analyzer configuration files This section lists the configuration options that exist in the files particular to Event Analyzer and are maintained via the EA Admin interface. These files are located within the EA installation subvolume.
Administration 3 Administration The EA charts and analysis section (Main UI) is separated from the administration that defines what the charts and analysis will contain. This section explains the administration of EA. 3-1 Admin (User Interface) 3-1-1 Overview The EA Administration is done through the EA Admin screen.
Administration 3-1-2 Functions and Settings EA Admin has six screens: Configuration, Collectors, Applications, Retentions, Exclusions, Alerts and Load. Generally most parameters are processed when the EA Collector runs, so settings represent the settings going forward and does not affect data already processed, except for retentions. Each of these seven options appears as a tab on the EA Admin screen and is explained below. These seven represent the distinct functions of EA administration.
Administration d. Action Event – Look back x days: When matching the action-taken event with an action-required event that occurred earlier, EA will look at the EAACT files for a past number of days as defined by this parameter. The number of days can range from 1 through 99. Default is 1 day, meaning it looks at the same day’s and previous day’s logs to find a match. These four parameters are stored in ENSCRIBE file EAPARAM.
Administration To remove collector(s) from the list on the right, select one or more collectors (for selecting multiple collectors, hold down the CTRL key while selecting the list box items) and click on ‘Remove’. [Back to TOC] 3-1-2-3 Manage Applications Figure 22 Admin - Manage Applications An Application is a collection of one or more Owner-Subsystem pairs that you desire to monitor as a group.
Administration more owner-subsystems from the list on the right (for selecting multiple owner-subsystems, hold down the CTRL key while selecting the list box items) and click on ‘Remove’. To remove an application altogether, select the application(s) by checking the box next to its name in the list on the left, and click on ‘Remove’. [Back to TOC] 3-1-2-4 Manage Retentions Figure 23 Admin – Manage Retentions This screen allows changing the retention for the various databases.
Administration 3-1-2-5 Manage Exclusions Figure 24 Admin – Manage Exclusions This screen allows adding one or more owner-subsystem combinations to the exclusion list. Once added to this list, the events for these owner-subsystems are eliminated when analyzing EMS activity. Important note: Owner Subsystem names are case sensitive. The top left part includes text fields to enter the owner and subsystem. Below the text fields are drop downs for selecting the owner and subsystem.
Administration 3-1-2-6 Manage Alert Definitions Figure 25 Admin – Manage Alert Definitions EA allows setting thresholds on the number of events generated by owner-subsystems per hour and per day. This is done through the Alert Definition screen. New alerts can be added by clicking the ‘Add New…’ button. Ones already added can be edited by clicking on the (pencil) icon. An alert in the form of an EMS event is thrown during the daily scan if the threshold is breached.
Administration Figure 26 Admin – Add/Edit Alert Definitions In the above screen, the hourly and daily thresholds represent the number of events that can be generated by the owner-subsystem in each hour/day respectively until EA throws an alert. The alert can be set to be enforced on one or more weekdays and for specific hours of the day. EA throws an EMS event having SSID 289, with details on the alert.
Administration 3-1-2-7 One-Time Loads Figure 27 Admin – One-Time Loads This screen provides options to perform one-time event loads from collectors or log files. This is useful in scenarios where EA was not running, technical issues were encountered or you just want to load old data within the defined retention range. The function provides the option the go via the Collector path to the events or directly to a particular EMS log file (i.e. Code 843).
Administration Figure 28 Admin - One-Time Loads log file search For e.g., the screenshot shows EMS log files found on disk $GUEST. Selecting a log file from the list will place that file name into the log file text field. Clicking on ‘Submit’ will cause a message to be sent to the EA Collector process (EACOLL) that will then scan through the collectors (option 1) or EMS log files (option 2) and populate the databases holding events count information.
Using Event Analyzer 4 Using Event Analyzer This section provides the operational details on the command and control of EA, with screenshots on the various options. 4-1 Application Activation EA uses two primary modules: The EA Collector and EA User Interface. The Collector program (EACOLL) is a process pair that runs 24*7 and collects event information daily. The UI program (EAVIEW) is launched when a user accesses EA through the browser.
Using Event Analyzer 4-2 Accessing Event Analyzer Functions The EA main screen and user functions appear as an option under the ‘Operations’ menu item in WVP. Open the IE browser, log into WVP and from the Operations menu, select ‘Event Analyzer’. This brings up the main screen. 4-3 Main Screen – Year Grid This section provides an explanation of the features of the main screen. 4-3-1 Overview This screen shows a year’s worth of data in the form of a two-dimensional grid.
Using Event Analyzer 4-3-2-1 Display The year grid is a two-dimensional grid with the months to the left and the dates at the top. Each cell shows the EMS activity for a given day of the month. You can switch from one year to another by changing the year dropdown selection on the top right corner. The cells are color-coded: Red cells represent past days that do not have any data. This might be either because the collector was not run that day or if there were no events matching the selection for that day.
Using Event Analyzer 4-3-2-2 Selection There are two levels of filters on the events. The first one is on the owner-subsystem-event # or application (group of owner-subsystems).
Using Event Analyzer Figure 33 Year Grid – Action Events Only [Back to TOC] 4-3-2-3 Drilldown Users can drilldown on the events for a day and the entire month. Clicking on a day cell will bring up a menu of options to drilldown for further analysis. Similarly, clicking on a month cell brings up a menu that has options to drilldown on the month level. These menus are explained next. Figure 34 Month Drilldown Options The drilldown options for the Month are: a.
Using Event Analyzer Figure 35 Day Drilldown Options The drilldown options for the Day are: a. Hourly: This option displays a stacked bar chart and grid showing all types of events for each hour of the day. This screen is explained in section 4-7 of this manual. b. Owner-Subsystem: This option displays a pie chart and grid showing the distribution of events by owner-subsystem. This screen is explained in section 4-8 of this manual. c.
Using Event Analyzer 4-4 Month Drilldown - Daily This section provides an explanation of the ‘Daily’ view. The ’Daily’ view is an option on the month drilldown. It lists the event counts for each day of the chosen month. 4-4-1 Overview The ‘Daily’ view is accessed from the main screen (yearly grid) by clicking on the month cell. It appears as the first menu item in the drilldown menu that shows up. 4-4-2 Description Figure 36 Month Drilldown – Daily This view shows the events by each day of the month.
Using Event Analyzer Figure 37 Daily – Tooltip The first row shows the type of events (non-action normal, non-action critical, etc.). The date is shown on the second row, while the third row shows the number of events of that event type. The grid below the chart shows, for each day of the month, the total count of events as well as a breakdown on the type of event. The grid can be sorted by any column. A yellow colored row indicates the given day had EA – generated alerts.
Using Event Analyzer 4-5 Month Drilldown – Hour of Days This section provides an explanation of the ‘Hour of Days’ view. The ’Hour of Days’ view is an option on the month drilldown. It lists the event counts for each day of the chosen month, but just for a chosen hour of the day. 4-5-1 Overview The ‘Hour of Days’ view is accessed from the main screen (yearly grid) by clicking on any of the month cells. It appears as the second menu item in the drilldown menu that shows up.
Using Event Analyzer total daily count. Rolling over various bars of the chart brings up tooltips with details on the value being charted as shown below: Figure 40 All Days – Given Hour – Tooltip The first row shows the type of events (non-action normal, non-action critical, etc.). The date is shown on the second row, while the third row shows the number of events of that event type generated for the hour specified.
Using Event Analyzer 4-6 Month Drilldown – Weekdays This section provides an explanation of the ‘Weekdays’ option. The ’Weekdays’ view is an option on the month drilldown. It lists the event counts for the chosen month, segregated by weekday. Further drilldown to see the daily breakdown for each weekday is available. 4-6-1 Overview The ‘Weekdays’ view is accessed from the main screen (yearly grid) by clicking on the month cell. It appears as the third menu item in the drilldown menu that shows up.
Using Event Analyzer This view shows the events by the weekdays of the month. The month selection dropdown on the top allows you to switch to another month. The toolbar on the left is the standard owner-subsystem-event # filter explained in section 1-1-4-2 (Toolbars) of this user manual. This filter is used to display events for a particular owner-subsystem, or a particular owner-subsystem-event # or an application.
Using Event Analyzer Figure 44 Weekday View - Drilldown This screen is similar to the ‘Monthly Drilldown –Daily’ view except that instead of all days of the month, only the days of the chosen weekday are displayed. You can switch between weekdays by choosing the weekday from the top right corner of the screen. The rest of the controls on this screen are similar to the ‘Monthly Drilldown – Daily’ screen which is explained in section 4-4 of the user manual.
Using Event Analyzer 4-7 Day Drilldown – Hourly This section provides an explanation of the ‘Hourly’ drilldown screen. The ‘Hourly’ view is an option on the day drilldown. It lists the event counts for each hour of the chosen day. 4-7-1 Overview The ‘Hourly’ screen is accessed from the main screen (yearly grid) by clicking on the day cell. It appears as the first menu item in the drilldown menu that shows up.
Using Event Analyzer Figure 46 Day Drilldown – Hourly – Tooltip The first row shows the type of events (non-action normal, non-action critical, etc.) while the second row shows the number of events of that event type generated for the hour. The grid below the chart shows, for each hour of the day, the total count of events as well as a breakdown on the type of events that were generated for the hour. The grid can be sorted by any column.
Using Event Analyzer 4-8 Day Drilldown – Owner-Subsystem This section provides an explanation of the ‘Owner-Subsystem’ drilldown screen. The ‘OwnerSubsystem’ view is an option on the day drilldown. It lists the event counts for each hour of the chosen day, segregated by owner-subsystem. 4-8-1 Overview The ‘Owner-Subsystem’ screen is accessed from the main screen (yearly grid) by clicking on the day cell. It appears as the second menu item in the drilldown menu that shows up.
Using Event Analyzer appears towards the right side of the chart. As can be seen from the chart legend, each ownersubsystem combination is represented by a different color on the chart. The area under the pie represents the total events for that day. Rolling over the different section of the pie brings up tooltips with details on the value being charted as shown below: Figure 49 Day Drilldown – Owner-Subsystem– Tooltip The first row of the tooltip is in .
Using Event Analyzer new window showing action event statistics for the day. This feature is explained in section 4-14 of this manual. d. Event Details: This option brings up a Web ViewPoint Lite EMS Viewer that displays the events for the chosen owner-subsystem for the day. This screen is explained in section 4-12 of this manual.
Using Event Analyzer 4-9 Owner-Subsystem – Hour of Day This section provides an explanation of the ‘Owner-Subsystem – Hour of Day’ drilldown screen. The ‘Owner-Subsystem – Hour of Day’ view is an option on the drilldown menu of the ‘Hour of Days’ (month drilldown) screen. It lists the event counts for a chosen hour and day, segregated by ownersubsystem.
Using Event Analyzer This filter is used to display events for a particular owner-subsystem, or a particular owner-subsystemevent # or an application. The chart type is a pie chart. Accompanying the chart is a chart legend, which shows for each section of the pie, the name of the section as well as the color it is identified by in the chart. This legend appears towards the right side of the chart.
Using Event Analyzer brings up a window that displays the alerts (EMS events) generated by EA for the day. This screen is explained in section 4-13 of this manual. c. Responsiveness: If there were action-required or action-taken events for the chosen ownersubsystem on that hour of the day, a menu item ‘Responsiveness’ is visible on the menu. This brings up a new window showing action event statistics for the day. This feature is explained in section 4-14 of this manual. d.
Using Event Analyzer 4-10 Event Numbers This section provides an explanation of the ‘Event Numbers’ drilldown screen. The ‘Event Numbers’ view is an option on the drilldown menu of the ‘Owner-Subsystem’ screen. It lists the event counts for a chosen day and owner-subsystem, segregated by event number. 4-10-1 Overview The ‘Event Numbers’ screen is accessed from the ‘Owner-Subsystem’ screen (section 4-8 of this user manual) by clicking on the ‘Event Numbers’ menu item of the drilldown menu.
Using Event Analyzer event # filter explained in section 1-1-4-2 (Toolbars) of this user manual. This filter is used to display events for a particular owner-subsystem, or a particular owner-subsystem-event # or an application. The chart type is a pie chart. Accompanying the chart is a chart legend, which shows for each section of the pie, the name of the section as well as the color it is identified by in the chart. This legend appears towards the right side of the chart.
Using Event Analyzer 4-11 Event Numbers – Hour of Day This section provides an explanation of the ‘Event Numbers – Hour of Day’ drilldown screen. The ’Event Numbers – Hour of Day’ view is an option on the drilldown menu of the ‘Owner-Subsystem – Hour of Day’ screen. It lists the event counts for a chosen hour, day and owner-subsystem, segregated by event number.
Using Event Analyzer user manual. This filter is used to display events for a particular owner-subsystem, a particular ownersubsystem-event # or an application. The chart type is a pie chart. Accompanying the chart is a chart legend, which shows for each section of the pie, the name of the section as well as the color it is identified by in the chart. This legend appears towards the right side of the chart.
Using Event Analyzer 4-12 Event Details This section provides an explanation of the ‘Event Details’ drilldown screen. This drilldown option is available on menus of several EA screens and is used to show details of the individual events such as date and time of generation, name of the process generating the events, and descriptive text. Each event also includes a link showing token dump and cause/effect/recovery information from EVENTTX if available.
Using Event Analyzer 4-12-3 Considerations The EMS Viewer has the following limitations: Critical Action events are included in the Events Details display even when non-action critical events are specified. [The counts in the table are correct]. Normal non-action events are included in the Events Details display even when non-critical action events are specified. [The counts in the table are correct].
Using Event Analyzer 4-13 Alerts This section provides an explanation of the ‘Alerts’ drilldown option. ‘Alerts’ refer to threshold counts defined for events on the Admin-Alert Definitions screen. The section explains where the alert thresholds can be defined and how the alerts can be viewed. 4-13-1 Overview The ‘Alerts’ screen is linked to from a number of other EA screens explained in previous sections. The interface is the same as the Event Details screen.
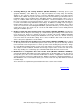
Using Event Analyzer Figure 60 Alerts shown in Event Details Screen Figure 60 shows how clicking on the ‘Alerts’ menu item brings up a window showing the alerts thrown by EA the next day to notify of the threshold breach on July 6. In this case, for example, the user sets a threshold of 100 maximum events per day for SSID 257. As is seen from the alert text, on July 6, there were 133 events which triggered EA to throw an alert notifying the user of this breach.
Using Event Analyzer 4-14 Responsiveness This section provides an explanation of the ‘Responsiveness’ screens. ‘Responsiveness’ refers to the time taken to acknowledge an action-required event. This section explains the ‘Responsiveness’ screen showing the action event response time statistics. 4-14-1 Overview The ‘Responsiveness’ screen can be reached at from the main screen (year grid), by clicking on the link reading ‘Responsiveness’.
Using Event Analyzer Figure 62 Response Times Tooltip The first row identifies the type of response time being graphed (max/min/avg). The second row specifies the hour of the day while the third row is the value, in hh:mm:ss format, of the data point. The grid below the chart lists the same information i.e. the response times for each hour. It can be sorted by any column. Two columns list the ‘Unmatched’ and the ‘Outstanding’ events.
Using Event Analyzer Figure 64 Unmatched or Outstanding Action Event Details In both the above views, the ‘Event #’ is a hyperlink. This will bring up the details of that event in the ‘Event Details’ window, as explained in section 4-12. Figure 65 Action Event Search The second option is to view the # of resolved action events having response time exceeding a certain value (in minutes).
Using Event Analyzer Figure 66 Action Event Search Tooltip The tooltip shows a count of the number of action events occurring at that hour. The grid below the chart lists the counts of action events for each hour. If the count is greater than zero, the number shows as a hyperlink. Clicking on this link gets you to a window showing details of the resolved action events. This is the same window as the one shown in Figure 63.
Appendix A 5 Appendix A 5-1-1 Software Support Support for Event Analyzer Plug-in is available through HP's 24-hour Global Mission Critical Support Centers (GMCSC) throughout the world. In the U.S. please call 1-800-255-5010. International numbers please see: http://h71014.www7.hp.com/gcscphone.html 5-1-2 Error & Advisory Messages (EMS Events) This section lists all EMS Events that can be generated specifically from the Event Analyzer application conditions and processing.
Appendix A NSEVNTA 103 : Error Reading file : Relating to function or activity: Reading from a key-sequenced file (database file) to access contents. Cause: Occurs on the “READX” Guardian procedure call. The Guardian error number indicating what the cause was is part of the event text. Could occur due to various reasons, for e.g. the operation timed out (Error 40).
Appendix A Effect: The primary EACOLL process will not be able to communicate with the backup and vice versa. This will prevent the backup process to take over as the primary in case the primary process goes down. The primary will not be aware if the backup goes down and the nonstop operation of EACOLL will not take effect. Recovery: Recovery will depend on the specific Guardian error returned. For e.g. Error 14 can be recovered from by restarting the Web ViewPoint (and hence EA) processes.
Appendix A Cause: Occurs on the “__ns_start_backup” Guardian procedure call. The Guardian error number indicating what the cause was is part of the event text. Could occur due to various reasons, for e.g. invalid process handle (Error 2). Effect: The primary process will be unable to create a backup process and the nonstop operation of EACOLL will not take effect. Recovery: Recovery will depend on the specific Guardian error returned. For e.g.
Appendix A : Writeupdate Error for file : Relating to function or activity: Updating a key-sequenced file (database file). Cause: Occurs on the “WRITEUPDATEX” Guardian procedure call. The Guardian error number indicating what the cause was is part of the event text. Could occur due to various reasons, for e.g. a record with that key exists already (Error 10).
Appendix A Recovery: Recovery will depend on the specific Guardian error returned. For e.g. Error 14 (device non-existent) can be recovered from by ensuring that the processes (for EACOLL and EAVIEW) are up and running. NSEVNTA 122 : Could not get process name of EA Collector Relating to function or activity: Admin interface program communicating with the EACOLL process. Cause: Occurs when getting the process name of the EACOLL program.
Appendix A Cause: Occurs on the “FILENAME_SCAN_” Guardian procedure call. The Guardian error number indicating what the cause was is part of the event text. Could occur due to various reasons, for e.g. incorrectly formed filename (Error 13). Effect: The changes made to the daily run time or the one-time loads initiated from the Admin screen will not be completed. Recovery: Recovery will depend on the specific Guardian error returned. For e.g.
Appendix A Recovery: Depends on the Filename and Error number. NSEVNTA 151 : Error Reading for file Relating to function or activity: Admin interface program communicating with the EACOLL process. Cause: Occurs when the admin interface program is unable to send update data to the EACOLL process. Effect: The parameters updated in the operation will not be reflected by in working of the EACOLL process. Recovery: Restart the EACOLL process.
Appendix A NSEVNTA 150 : Loading events from log file : Loading events from collector for the date range specified : Getting %d previous days' worth of events : Beginning daily scan of events : Daily Run Time Updated Relating to function or activity: The EACOLL process will generate informational messages with event number 150 at the time of the da
Error! No text of specified style in document. Function or activity: Scope Selection Toolbars Missing Event Number Cause: The event number checkbox is checked but the text field is empty. Recovery: Either uncheck the checkbox for event number, or enter a valid event number in the text field. Event Number should be an integer in the range [-32767, 32767] Cause: The event number entered is in the wrong format. Recovery: Correct the event number entered i.e. integer between -32767 and 32767.
Error! No text of specified style in document. Cause: Incorrect day entered as part of the date string. Recovery: Correct the day i.e. an integer in the valid range depending on the month chosen. Invalid value for the month in the specified date: Cause: Incorrect month entered as part of the date string. Recovery: Correct the month i.e. an integer lying between 1 and 12.
Error! No text of specified style in document. Function or activity: EA Admin – Manage Collectors screen Missing collector name Cause: The collector name was missing in the text field and the ‘Add’ button was clicked. Recovery: Enter the collector name in the text field. Collector name can be max. 6 characters Cause: The collector name is entered in an invalid format.
Error! No text of specified style in document. Recovery: Enter the application name in the text field. Application name can be max. 16 characters Cause: The application name is entered in an invalid format. Recovery: Enter the application name in the correct format (up to 16 characters long and containing alphabets and numbers only). Application name can contain alphabets and numbers only Cause: The application name is entered in an invalid format.
Error! No text of specified style in document. Owner-Subsystem Exists Already! Cause: The owner-subsystem combination being added is already present in the application definition. Recovery: Only add owner-subsystem names not already part of the application definition. Please select Owner-Subsystem combination(s) to remove from the list Cause: The ‘Remove’ button was clicked but no owner-subsystem combinations were selected for removal.
Error! No text of specified style in document. Recovery: Enter the subsystem name in the text field. Invalid Owner name. Please use alphabets, numbers and the hyphen (-) sign only Cause: The owner name is entered in an invalid format. Recovery: Enter the owner name in the correct format (up to 8 characters long and containing alphabets, numbers and the hyphen (-) sign only). Invalid Subsystem name.
Error! No text of specified style in document. Hourly Threshold should be an integer 0 or higher Cause: The hourly threshold value is entered in an invalid format. Recovery: Enter the hourly threshold value in the correct format (integer in the range 1 through 9999). Daily Threshold should be an integer 0 or higher Cause: The daily threshold value is entered in an invalid format. Recovery: Enter the daily threshold value in the correct format (integer in the range 1 through 9999).
Error! No text of specified style in document. Alert definition added Cause: Informational message that comes up to after the alert definition is successfully added. Alert definition updated Cause: Informational message that comes up to after the alert definition is successfully. Record not found! Cause: The record for the alert definition trying to be updated no longer exists in the database EAALERTT. Recovery: Restore the alerts database EAALERTT to the EA subvolume.
Error! No text of specified style in document. Recovery: Enter the “to date” in the correct (yyyy-mm-dd) format. Invalid value for the day in the From Date: Cause: The first radio button is checked (load form Collectors) and the “from date” day value is incorrect. Recovery: Enter the day in the correct format (from 1 through the maximum number of days for the month entered).