HP Insight Management Agents 9.1 User Guide Abstract This guide provides information about the Hewlett-Packard Insight Management Agents software, including the usage, managing, and troubleshooting. This guide is intended is for the person who installs, administers, and troubleshoots servers and storage systems. HP assumes you are qualified in the servicing of computer equipment and trained in recognizing hazards in products with hazardous energy levels.
© Copyright 2011, 2012 Hewlett-Packard Development Company, L.P. The information contained herein is subject to change without notice. The only warranties for HP products and services are set forth in the express warranty statements accompanying such products and services. Nothing herein should be construed as constituting an additional warranty. HP shall not be liable for technical or editorial errors or omissions contained herein. Confidential computer software.
Contents 1 HP Insight Management Agents for servers....................................................9 Browser requirements ...............................................................................................................9 Java Virtual Machine requirements............................................................................................10 Obtaining JVM from HP.com...............................................................................................
User Preferences...........................................................................................................24 Tasks tab..........................................................................................................................25 Logs tab...........................................................................................................................25 Webapps tab...........................................................................................................
Temperature Information............................................................................................70 Fan Information........................................................................................................70 Array Controller Information...........................................................................................71 Accelerator Information..................................................................................................72 Identify Drives...........
Connection Information...........................................................................................110 Sub-system Classification.......................................................................................................112 Power Subsystem..............................................................................................................112 Cooling and temperature..................................................................................................
System Resources .......................................................................................................137 System Summary ........................................................................................................138 Enclosure Information...................................................................................................139 Information availability to a WMI consumer........................................................................141 Critical Error Log.....
A Troubleshooting ....................................................................................160 Insight Management Agents for servers issues..........................................................................160 Inability to perform remote reboot on a server from the Management Console.........................160 When attempting to browse to Web-Enabled System Management software on port 2381, the system is not accessible because of an invalid password........................................
1 HP Insight Management Agents for servers The HP System Management Homepage version 8.25 and later acts as the Web server for the Management Agents. For additional information, see the System Management Homepage Online Help. Browser requirements The minimum browser requirements include support for tables, frames, Java™, JavaScript, and Java Development Kit (JDK) 1.1.
Java Virtual Machine requirements HP Web-Enabled System Management software requires Java for full functionality. At a minimum, the help system relies on a Java applet to provide a table of contents, an index, and search capability. Depending on what Web-Enabled System Management software is installed, there might be other features that are either partially or fully dependent on the presence of Java support in the browser. Obtaining JVM from HP.
Accessing on a different operating systems To access Insight Management Agents from a browser running on a machine not running a Microsoft OS, complete one of the following procedures: • To view data locally, access through either of the following connections: ◦ Secure connection: https://127.0.0.2381 ◦ Unsecure connection: http://localhost:2301 To view data remotely, access through http://machine:2301, where “machine” is the IP address or the computer name under DNS.
When the System Management Homepage is launched for the first time on operating systems other than those from Microsoft and Linux, anonymous access to information is available without logging in. Deploying the configurations to servers running Microsoft Windows On systems running Microsoft OS, anonymous access is disabled by default. To turn on anonymous access, complete the following steps: 1. Open the System Management Homepage 2. Select Settings>SMH>Security>Anonymous/Local Access. 3.
Deploying the configurations to servers running NetWare In NetWare, the webagent.INI file is located in the sys:\system\cpqmgmt\webagent directory and specifies the level of a user with access to data. The “read=” and “write=” entries in the file set the user accounts required for access: • 0 = No access • 1 = anonymous • 2 = user • 3 = operator • 4 = administrator Changing these entries changes the security. The Web Agent service must be stopped and restarted for any changes to take effect.
NOTE: The Security Alert dialog box shown is specific to Internet Explorer. However, Netscape 4.0 and later is supported as well. NOTE: If you want to implement your own Public-key infrastructure (PKI) or install your own generated certificates into each managed device, you can install a Certificate Authority Root Certificate onto each browser to be used for management. If this certificate is implemented, the Security Alert dialog box, shown in the following illustration, should not be displayed.
NOTE: If you have enabled anonymous access, then you can access the System Management Homepage displays without asking for any credentials locally. NOTE: For the Version Control Repository Manager, the anonymous login (if enabled) and the user login enable you to access all pages. However, you cannot configure a repository; delete, copy, or create ProLiant Support Packs; install components; or clear the log. The anonymous login is disabled by default.
• Management processor – Integrated Lights Out • Data source • Switch to List view • Switch to Icon view • Legend • Refresh User The User field displays the identity of the user that is currently logged in. If the current user is administrator, then a Sign Out link displays. If anonymous access is enabled and you are accessing the page anonymously, the User displays “Anonymous,” and the Sign In link displays.
Figure 4 System Management Homepage — List View Switch to icon view Displays the System Management Homepage contents as folder icons. Figure 5 System Management Homepage — Icon View Legend Displays the meaning of the status icons.
Figure 6 System Management Homepage — Status Icons Refresh Click on the Refresh link to refresh the System Management Homepage. Body frame The body of the window displays the status for all HP management system details. System Management Homepage tabs The System Management Homepage displays up to five tabbed pages that enable you to access and configure settings related to participating HP web-enabled System Management software.
• System Configuration • Version Control Figure 7 System Management Homepage — Home tab Overall System Health Status The Overall System Health Status displays a status icon with a label under it. A specific webapp sets the value of the Overall System Health Status icon by using a predefined heuristic to signal the overall system health status. If no webapp sets the overall system health status, then the worst of all the statuses in the Component Status Summary box is displayed.
The window also displays information about the following NIC components: • Embedded NIC • Integrated Lights-Out NIC NIC The NIC displays information about the following networking components: • Embedded NIC • Virtual Interface Operating system The Operating System window displays the following information about the operating environment: • File system space used • Logical Disks • Processors • Server • Memory • Network • Physical Disks • Processes • Processor Utilization Storage The
Settings tab The Settings tab provides you with the ability to access the agent options and define the Management HTTP Server security settings. Figure 8 System Management Homepage — Settings tab Settings section The Settings section provides a listing of participating agents. Each of the participating agents has options already defined. Select SMH Data Source This section allows to set the data source type to WBEM or SNMP.
Figure 10 System Management Homepage — SNMP & Agent Settings page If you make Management Agents Configuration changes, you must click the Restart Agents button for changes to the HP Management Agents (Server Agents, Foundation Agents, Storage Agents, and NIC Agents) settings to take effect on the server. • Server Role—Displays the description of the system’s role or function. You can also set the Server Role text on multiple devices by creating a Group Configuration Task in System Insight Manager.
Security Provides following options and also contains notes which describe the usage of the each of the option available and also procedure to set the values • Anonymous/Local Access —Enables the administrator to set options that allow anonymous users to access SMH pages or to allow automatic login to SMH when running in a local console as administrator or anonymous user. • IP Binding —Enables you to control the addresses that SMH is bound to.
are considered less secure than certificate based trust modes. The following are the security options in the Trust Mode: ◦ Trust by Certificate—Sets HP SMH to accept configuration changes only from HP SIM servers with trusted certificates. This mode requires the submitted server to provide authentication by means of certificates. This mode is the strongest method of security because it requires certificate data and verifies the digital signature before allowing access.
Tasks tab The Tasks tab displays links to task-oriented pages provided by participating HP Web-Enabled System Management software. NOTE: If the HP Web-Enabled System Management software provides no tasks, the Tasks tab is not visible. Figure 11 System Management Homepage — Tasks tab Logs tab The Logs tab includes various log information like Integrated Management Log, HP Version Control Agent Log, Integrated Lights-Out Log, and System Management Homepage Log.
Figure 13 System Management Homepage — Webapps tab Support tab The Support tab contains of links to available support services like – ProLiant Essential Software Info, Integrity Essential Software Info, Support Links, and Forum links. Help tab The Help page provides help for the HP System Management Homepage (HP SMH) and its webapps. Using the search option, you can search for a keyword in SMH help and the selected webapps.
2 Agent information Management Host agent The Management Host agent gathers data for the HP Host OS MIB.
Threshold Agent The Threshold Agent is designed to provide support for HP Insight Manager user-defined thresholds. It also provides a generic way to set thresholds on objects in any HP SNMP MIB. Users can set thresholds on counter or gauge MIB variables. Each selected MIB variable is periodically sampled by the Threshold Agent at a rate defined by the user. MIB data values are compared to user-configured thresholds.
Cluster resources groups The Cluster Resources Groups section displays the cluster resources by resource group. The following information might appear: • Name—Displays the name of the resource and the color status associated with the resource state. • State—Displays the current state of the resource, which can be one of the following: ◦ Online—The resource is online and functioning normally. ◦ Offline—The resource is offline. ◦ Online pending—The resource is in the process of coming online.
• Address Mask—Displays the address mask used by the network in the format specified by the transport type. • Description—Displays the text network description if one was entered. Cluster interconnect The Cluster Interconnect section displays the following information about the adapters used for cluster interconnections: • Network—Displays the name of the network. • Address—Displays the address used by the interconnect in the format specified by the transport type.
Agents might need to be updated. Select any of the devices from the submenu to display more information about the devices. The following information displays for all devices: • Device Type—Identifies the type of ATAPI device. The following values are valid: ◦ Disk—A direct-access device, such as a disk drive. ◦ Removable Media Disk—A removable media device, such as a floppy disk drive. ◦ Tape—A sequential-access device, such as a tape drive. ◦ Printer—A printer device.
• Failed—The disk drive has failed and must be replaced. ◦ Unknown—The Storage Agents cannot determine the status of the disk drive. You might need to upgrade your driver software or Storage Agents. S.M.A.R.T. Support—Indicates whether S.M.A.R.T. support is available for this disk drive. The following values are valid: ◦ Available—This drive supports predictive failure monitoring. ◦ Not Available—This drive does not support predictive failure monitoring.
• • Disk Type—Indicates the type of disk drive. The following values are valid: ◦ ATA—The disk is a parallel ATA disk drive. ◦ SATA—The disk is a Serial ATA disk drive. ◦ Unknown—The Storage Agents cannot determine the disk type. Media Type indicates the type of media the physical drive is composed of. The following values are valid: ◦ Rotating Platters—The physical drive media is composed of rotating platters. ◦ Solid State—The physical drive media is composed of solid state electronics.
• ◦ Rebuilding—Indicates that the logical drive is rebuilding a physical drive. When complete, the logical drive returns to normal operation. ◦ Failed—Indicates that more physical drives have failed than the RAID level of the logical drive can handle without data loss. ◦ Unknown—The agent cannot determine the logical drive status. You might need to upgrade your software. Fault Tolerance—Displays the fault tolerance mode of the logical drive.
The following information displays for each controller: • Model—Displays the type of controller card. • Controller Status—Displays the array controller board status. The following values are valid: • • • ◦ OK—The array controller is operating properly. ◦ General Failure—The array controller has failed. ◦ Cable Problem—The array controller has a cable problem. Check all cables to the controller. ◦ Powered Off—The array controller does not have power.
◦ Different Firmware—The other controller indicates a different firmware version. ◦ Different Cache—The other controller indicates a different cache size. ◦ Other Cache Failure—The other controller indicates a cache failure. ◦ No Drives—This controller cannot see any attached drives, but the other controller can. ◦ Other No Drives—This controller can see the attached drives, but the other controller cannot.
• • • Daughter Board Type—Displays the type of daughter board installed on the array controller. The following values are valid: ◦ Not Supported—Indicates that the array controller does not support daughter boards or it does not support daughter board identification. ◦ Not Present—Indicates that a daughter board is not installed on the array controller. ◦ SCSI—Indicates that a SCSI daughter board is installed on the array controller.
◦ RAID Stack Version—lists the RAID stack version operating the B-series array controller. This value may change when upgrading or downgrading the operating system device driver. ◦ Option ROM Version—lists the option ROM revision of the chipset or HBA being used by the B-Series controller. ◦ HBA Firmware Version—lists the firmware revision of the chipset or HBA being used by the B-Series controller.
has not retained any data that may have been stored in the cache. If no data was in the cache, no data was lost. Several situations may have caused this condition: • • – If the system was without power for eight days, and the battery pack was on (the battery pack activates only if the system loses power unexpectedly), any data that may have been stored was lost. – There may be a problem with the battery pack. See the Battery Status monitored item for more information.
◦ Replace Battery—The array controller has one or more array accelerator batteries that are failed. Cache Module operations such as Battery Backed Write Cache, Expansion, Extension and Migration are temporarily suspended until the batteries are replaced. Consult the user guide to learn how to identify and replace failed batteries. ◦ Low Battery—The array controller has one or more array accelerator batteries that are recharging.
◦ ADG Enabler Missing—Indicates that write cache operations have been temporarily disabled. An advanced data guarding logical drive is configured but the RAID ADG Enabler Module is broken or missing. ◦ POST ECC Errors—Indicates that write cache operations have been permanently disabled. The cache has been disabled due to a large number of ECC errors detected while testing the cache during the Power On Self Test (POST).
• Write Cache—Displays the percentage of cache memory allocated for posted write caching or the amount of memory allocated for the write cache. If the amount of memory is displayed then the actual usable memory is half the amount shown because the data is kept in duplicate (mirrored). • Read Cache—Displays the percentage of cache memory allocated for read ahead caching or the amount of memory allocated for the read cache.
IMPORTANT: The Start or Stop button only displays if you are logged on as an administrator or an operator, SNMP Sets are enabled, and a SNMP Community string has been defined with 'write' access. Go back to the Summary page and select login to login as an administrator or operator. SNMP Sets can be enabled in the HP Insight Management Agents control panel applet on the SNMP Settings page.
• Authentication Status—Displays the authentication status for this device. The following values are valid: ◦ Authentication Passed—The physical drive has passed all authentication tests and has been validated to be a genuine HP hard drive. ◦ Authentication Failed—The physical drive could not be authenticated as a genuine HP hard drive. The array controller will no longer control the drive LEDs. Replace the hard drive with a genuine HP hard drive.
• Current Speed—Displays the current negotiated data transfer rate for a SCSI physical drive. The possible values are: ◦ Asynchronous—The negotiated data transfer rate for this drive is asynchronous. ◦ Fast—The negotiated data transfer rate for this drive is 20 megabytes per second. ◦ Ultra—The negotiated data transfer rate for this drive is 40 megabytes per second. ◦ Ultra2—The negotiated data transfer rate for this drive is 80 megabytes per second.
• • 46 Negotiated Link Rate—Displays the negotiated link rate for SAS and SATA physical drives. The possible values are: ◦ 1.5 Gbps—The negotiated link rate for this drive is 1.5 gigabits per second. ◦ 3.0 Gbps—The negotiated link rate for this drive is 3.0 gigabits per second. ◦ 6.0 Gbps—The negotiated link rate for this drive is 6.0 gigabits per second. ◦ Unknown—The agent is unable to determine the negotiated link rate for this drive.
Paths For multipath-capable hardware, the status and role of each data path to the physical drive is reported. • Path—Indicates the path to the physical drive. Each path is identified by a descriptor, for example "Port 2E Box 1 Bay 12" indicates a path from the host adapter external port number 2 ("Port 2E") to the 12th bay in the first box. • Status—Indicates the status of the data path. Possible values are: • ◦ OK—The path is operational. ◦ Link down—The path is not operational.
Identify Drive Select the length of time to identify the physical drive from the drop-down list box and then click the Start button. The page automatically refreshes, and then an image of an identified drive and a Stop button appears. Click the Stop button to end identification before the time expires. After the drive identification completes, the page must be manually refreshed to display the Start button.
Predictive Indicators Use the Predictive Indicators to predict when a drive, which is now operating normally, may need to be replaced. • S.M.A.R.T. Status—Displays the S.M.A.R.T. status as reported by the physical drive. This is only displayed if the drive supports S.M.A.R.T. predictive failure. The possible values are: ◦ Other—The Storage Agent is unable to determine the status of S.M.A.R.T. predictive failure monitoring for this drive. ◦ OK—Indicates the drive is functioning properly.
Problem Indicators Use the Problem Indicators to determine when a drive failure has occurred that may be correctable without replacing the drive. The Problem Indicators are: • Failed Recovery Reads—Shows the number of read errors that occurred while Automatic Data Recovery was being performed from this physical drive to another drive. If a read error occurs, Automatic Data Recovery stops.
1. 2. 3. Ensure that all system and storage system cables are intact and seated properly. You may need to replace cables. Check the physical proximity of the system to other electrical devices. Since electrical noise may cause a glitch error, check the AC circuit for other electrical devices. If you continue to receive many of these errors, replace the drive. NOTE: If the drive has not failed, the above counts simply provide a cumulative record of past errors that have been corrected.
• Hardware Errors—The Hardware Errors counter records the number of times that a physical SCSI drive returned a Hardware Error status when a SCSI command was attempted. This error status indicates unsuccessful termination of the SCSI command. The controller typically retries this command several times before failing the drive. If the number of hardware errors is not zero and the drive has failed, replace the drive.
• Recovered Read Errors—Displays the number of read errors corrected through physical drive retries. Over time, all drives produce these errors. If you notice a rapid increase in the value for Recovered Read Errors or Hard Read Errors, a problem may exist with the drive. Expect more errors for this monitored item than for Hard Read Errors. • Total Seeks—Displays the total number of seek operations during seek tests performed by the physical drive since the drive was stamped.
◦ Ready rebuild—Indicates that the logical drive is ready for Automatic Data Recovery. The physical drive that failed has been replaced, but the logical drive is still operating in Interim Recovery Mode. ◦ Rebuilding—Indicates that the logical drive is currently doing Automatic Data Recovery. During Automatic Data Recovery, fault tolerance algorithms restore data to the replacement drive. ◦ Wrong drive—Indicates that the wrong physical drive was replaced after a physical drive failure.
When the status is Rebuilding one of the following values displays to indicate the progress of the rebuild: • ◦ Percent Rebuild Complete—Displays the percent complete of the rebuild. When the value reaches 100, the rebuilding process is complete. The drive array continues to operate in interim recovery mode while the drive is rebuilding. ◦ Rebuild Blocks Left—Displays the number of blocks of data that still need to be redistributed. When the value reaches 0, the rebuilding process is complete.
RAID 60—Advanced data guarding (RAID 6) with multiple parity groups. ◦ RAID 1 (ADM) - Advanced Data Mirroring—For each physical drive, there are two or more physical drives containing identical data. If a drive fails, the data can be retrieved from any of the mirrored drives. ◦ RAID 10 (ADM) - Advanced Data Mirroring with Striping—For each physical drive, there are two or more physical drives containing identical data in addition to data being striped across multiple drives.
Identify Drive 1. 2. Select the length of time to identify the physical drives that make up the logical drive from the drop-down list box, and then click the Start button. The page automatically refreshes and an image of an identified drive and a Stop button appears. Click the Stop button to end identification before the time expires. After the drive identification completes, the page must be manually refreshed to display the Start button.
• • • Protocol Type—Displays the protocol used to communicate with the tape library. The following values are valid: ◦ Parallel SCSI—The protocol is Parallel SCSI. ◦ Serial ATA—The protocol is Serial ATA. ◦ SAS—The protocol is Serial Attached SCSI. ◦ Unknown—The Storage Agents are unable to determine the protocol. Current Width—Displays the current negotiated data transfer width for Parallel SCSI tape libraries.
– Open—The door is open. – Unknown—The state of the tape library door cannot be determined. You may need to upgrade the Storage Agents. • Total Moves—Displays the number of tape moves for the library loader arm. • Service Hours—Displays the number of hours of operation for the library. Associated Tape Drives To see more information about the tape drive, see the product information on the HP website http:// www.hp.com/.
• • Current Width—Displays the current negotiated data transfer width for Parallel SCSI tape drives. The possible values are: ◦ Narrow (8 bits)—The negotiated data transfer width for this drive is narrow (8 data bits). ◦ Wide (16 bits)—The negotiated data transfer width for this drive is wide (16 data bits). ◦ Unknown—The Storage Agents are unable to determine the current negotiated data transfer width for this drive.
• • Library Drive—Indicates whether the tape drive is included in a tape library. The following values are valid: ◦ Yes—The tape drive is included in a tape library. ◦ No—The tape drive is not included in a tape library. ◦ Unknown—The Storage Agents are unable to determine if the tape drive is included in a tape library. Tape Errors—Displays the total number of read and write errors encountered. This value is maintained from the moment the Tape Hardware Interface driver was loaded.
• • Tape Drive Heads Need Cleaning—Indicates whether the tape drive need to be cleaned. To clean the tape heads, insert a cleaning tape into the drive and run through a cleaning cycle. The following values are valid: ◦ Yes—The tape drive requires a cleaning tape session in order to clean the heads. ◦ No—The tape drive does not require any cleaning tape session. ◦ Not Supported—The tape drive does not support monitoring of the cleaning required status.
• • ◦ Unknown—The Storage Agents do not recognize the status of the fan subsystem. You may need to upgrade your software. ◦ No Fan—This storage system does not have a fan. Backplane Speed—Displays the speed of the storage system backplane. The following values are possible: ◦ Ultra3—The storage system is capable of Ultra3 speeds. ◦ Ultra320—The storage system is capable of Ultra320 speeds. ◦ Unknown—The Storage Agents are unable to determine the storage system backplane speed.
• • • Duplex Option—Displays the duplex option installed in this storage system. The following values are possible: ◦ Duplex Top—This storage system is the top part of a duplexed unit. ◦ Duplex Bottom—This storage system is the bottom part of a duplexed unit. ◦ None—A duplex option is not installed. Power Supply Status—Displays the status of the redundant power supply.
• Snapshot Resource Volumes • Fibre Channel Switch Information • RAID Array Storage Systems • External Storage Connections Storage System Information Select the Storage System Information entry from the Mass Storage submenu to display the following information about an external array storage system: Storage System Chassis Information • Model displays the type of storage system chassis. • Name displays the user-defined name (or serial number, if preferred) of this storage system chassis.
• • 66 ◦ 1 Port Ultra320 SCSI Module - A 1 Port Ultra320 SCSI I/O Module is installed. ◦ Unknown - The Storage Agents cannot determine the IO module type for this storage system. RSO Status displays the status of the Recovery Server Option. Two servers are connected to the storage system so that when one fails the other server takes control of the storage system. The following values are possible: ◦ OK - The recovery server option is installed and the other server is working correctly.
◦ Manual - The preferred path for each logical drive is manually configured by the storage system administrator. ◦ Unknown - The Storage Agents cannot determine the preferred path mode of the storage system. Internal or External Storage System Information This information is not available for all types of storage systems. Internal storage system information will be displayed with the External Array Storage System Information.
• Drive Bays displays the number of bays on this storage system backplane. • Temperature Status displays the current temperature status of the storage system backplane. The following values are possible: • • • 68 ◦ OK - The temperature is within the normal operating range. ◦ Degraded - The temperature is outside of the normal operating range. ◦ Failed - The temperature has exceeded the safe operating temperature and could permanently damage the storage system.
◦ Duplex Bottom - This is the bottom portion of a duplexed storage system. ◦ Unknown - The Storage Agents are unable to determine if this storage system is duplexed. Backplane Information This information is not available for all types of storage systems. • Firmware Revision displays the revision level of storage system backplane. • Drive Bays displays the number of drive bays on this storage system backplane. • Duplex displays the storage system backplane duplex option.
Temperature Information This information is not available for all types of storage systems. • • Description displays the description of the temperature sensor. The following values are possible: ◦ Fan Bay - This temperature sensor is located on the fan module in the fan bay. ◦ Backplane - This temperature sensor is located on the SCSI drive backplane. ◦ Unknown - The Storage Agents are unable to determine the location of this storage system temperature sensor.
Array Controller Information This section displays the following information about array controllers that are installed in a storage system. • Model displays the model name of the controller card. • Firmware Version displays the version of the controller's firmware. • Serial Number displays the serial number of the controller. Use this information for identification purposes. • Product Revision displays the product revision of the controller.
• • ◦ Backup - This duplexed array controller is the backup controller. ◦ Unknown - Indicates that the Storage Agents are unable to determine the role of the controller. You may need to upgrade the Storage Agents. Redundancy Type displays the type of redundant configuration. The following values are valid: ◦ Not Redundant - This array controller is not in a redundant configuration.
• • • ◦ Permanently Disabled - operations have been permanently disabled. Check the Array Accelerator Error Code for the monitored item to determine why the cache operations have been permanently disabled. ◦ Unavailable - An Array Accelerator has not been configured. Battery Status displays the status of the battery pack on the Array Accelerator. The battery pack can recharge only when the system is powered on. The status can be one of the following: ◦ OK - The battery pack is fully charged.
• Serial Number displays the serial number of the accelerator board. Use this value to further identify the cache controller. • Error Code displays the status of the cache operations. The status can be one of the following: ◦ None - Write cache operations are currently configured and enabled for at least one logical drive. No write cache errors have occurred. ◦ Bad Configuration - Write cache operations are temporarily disabled. The Array Accelerator board was configured for a different controller.
◦ Redundant Low Battery - Cache operations are temporarily disabled. The redundant controller has insufficient cache battery power. ◦ Redundant Size Mismatch - Cache operations are temporarily disabled. The cache sizes on the redundant controllers do not match. ◦ Redundant Cache Failure - Cache operations are temporarily disabled. The cache on the redundant controller has failed. ◦ Excessive ECC Errors - Cache operations have been permanently disabled.
Select any of the physical drives from the Mass Storage submenu to display more information about the drive. The following information can be displayed: • • Status displays the status of the physical drive. The following values are possible: ◦ OK - The drive is functioning properly. ◦ Unconfigured - Indicates the drive is present, but is not part of any logical drive configuration. ◦ Threshold Exceeded - Indicates that the drive has a threshold exceeded error and should be replaced.
NOTE: A value of Unknown indicates that the agents are unable to determine this information from the physical drive. • • Current Width displays the current negotiated data transfer width for the physical drive. The possible values are: ◦ Narrow (8 bits) - The negotiated data transfer width for this drive is narrow (8 data bits). ◦ Wide (16 bits) - The negotiated data transfer width for this drive is wide (16 data bits).
• • Drive Type indicates the type of physical drive. The following values are valid: ◦ SCSI - The physical drive is a parallel SCSI drive. ◦ SATA - The physical drive is a Serial ATA drive. ◦ Unknown - The Storage Agents cannot determine the drive type. SATA Version indicates the version of Serial ATA. The following values are valid: ◦ One - The Serial ATA version is one. ◦ Two - The Serial ATA version is two.
◦ Ready for rebuild - The logical drive is ready for Automatic Data Recovery. The physical drive that failed has been replaced, but the logical drive is still operating in Interim Recovery Mode. ◦ Rebuilding - The logical drive is currently doing Automatic Data Recovery. During Automatic Data Recovery, fault tolerance algorithms restore data to the replacement drive. ◦ Wrong drive - The wrong physical drive was replaced after a physical drive failure.
information is distributed across all of the drives. If a failure is detected, the Drive Array Controller rebuilds the data using the data guard information from all the drives. ◦ Advanced Data Guarding - (RAID ADG) is the fault tolerance method that provides the highest level of data protection. It stripes data and parity across all the physical drives in the configuration to ensure the uninterrupted availability of uncorrupted data.
IMPORTANT: The Start or Stop button will only be displayed if you are logged on as an administrator or an operator, SNMP Sets are enabled, and a SNMP Community string has been defined with 'write' access. Go back to the Summary page and select login to login as an administrator or operator. SNMP Sets can be enabled in the HP Insight Management Agents control panel applet on the SNMP Settings page.
◦ Resource Volume Obsolete and Failed - The snapshot resource volume is obsolete and failed. ◦ Unknown - The Storage Agents were unable to determine the status of the snapshot resource volume. • Disabled Instances displays the number of disabled snapshot instances on this snapshot resource volume. • Snapshot Creation indicates if snapshot creation is allowed on this resource volume. The following values are valid: ◦ Allowed - Snapshot creation is allowed.
Fibre Channel Switch Information The fibre channel switch information includes the name, location, storage system slot, world wide node name, world wide port name, IP address, subnet mask, and gateway address. If the IP address is configured then a Configure Switch button is displayed. • Firmware Revision displays the firmware revision of the switch. • Location indicates the switch location if it resides within an external array storage system.
RAID Array Storage Systems Select the RAID Array Storage Systems item from the Mass Storage submenu to display the following information for each storage system: • Name identifies the type of storage system for identification purposes. • Status displays the current status of the storage system. The following values are valid: ◦ Good - Indicates that the system is working properly. ◦ Warning - indicates that at least one component of the system failed.
• Firmware Version indicates the version of firmware for this controller. • Option ROM Version indicates the version of the option ROM for this controller. • Storage Systems displays all of the attached storage systems. Select a storage system entry to display the related Storage System Information. • IO Slot displays the storage system IO slot number that is connected to the host controller. • Tape Controllers displays all of the Fibre Channel tape controllers attached to the host controller.
libraries, CD libraries, scanners, optical drives, WORM drives, and so on.
• Firmware Version—Displays the SCSI controller’s BIOS firmware version number. This information is not available for all SCSI controllers. • Bus Width—Displays the physical width of the data transfer bus of the SCSI controller. The following values are valid: • ◦ Narrow (8 bits)—The controller supports a narrow 8-bit data transfer bus. ◦ Wide (16 bits)—The controller supports a wide 16-bit data transfer bus. ◦ Unknown—The agent is unable to determine the physical width of the data transfer bus.
The following information is a list of device types and the information displayed for all SCSI devices: • Device Type—Identifies the type of SCSI device. The following values are valid: ◦ Disk—A direct-access device, such as a disk drive. ◦ Removable Disk—A removable media device, such as a floppy disk drive. ◦ Tape—A sequential-access device, such as a tape drive. ◦ Printer—A printer device. ◦ Processor—An operating device, such as a central processing unit or ProLiant Storage System.
• Serial Number—Displays the unit serial number for the library. It can be used for identification purposes. • Firmware Version—Displays the firmware revision level of the tape library as returned by the SCSI inquiry command. • Service Hours—Displays the number of hours in service. • Total Moves—Displays the total number of moves. • Door Status—Displays the tape library door status. The following values are valid: • • • ◦ Open—Indicates that the tape library door is open.
◦ Not supported—Indicates that the library cannot detect or report hot-swap status. ◦ Unknown—The hot-swap status of the tape library cannot be determined. Ensure the latest drivers and Storage Agents are installed. • Last Known Error—Displays the hexadecimal error status code including text information, if available. For details, see the hardware documentation for more information. • Associated Tape Drives—Displays a list of tape drives associated with the tape storage system.
• • • Library Drive—Indicates whether the tape drive is included in a tape library. The following values are valid: ◦ Yes—The tape drive is included in a tape library. ◦ No—The tape drive is not included in a tape library. ◦ Unknown—The Storage Agents are unable to determine if the tape drive is included in a tape library. Media Changer Information—Displays the autoloader media changer information. This only displays when the tape device is an autoloader.
• Cleaning Tape Needs Replacement—Indicates the cleaning tape associated with the autoloader is at the end of the tape. If the cleaning tape is at the end of the tape, a new cleaning tape must be placed in the autoloader. NOTE: A value of “Not Supported” indicates that the tape drive does not support this feature. You might need to upgrade your firmware to the latest revision. • Number of Cleanings Performed—Indicates the number of times that the tape drive has been cleaned.
Storage systems Select a storage system item from the SCSI controller submenu to display the following information about ProLiant Storage Systems. • Box Type—Displays the type of drive enclosure, or box. The following types of enclosures are possible: ◦ External Storage System—Outside the machine. ◦ Internal Storage System—Inside the machine. ◦ Unknown—The Storage Agents do not recognize the drive enclosure. You might need to upgrade your software.
• Backplane Speed—Displays the speed of the storage system backplane. The following values are possible: ◦ Ultra3—The storage system is capable of Ultra3 speeds. ◦ Ultra320—The storage system is capable of Ultra320 speeds. ◦ Unknown—The Storage Agents are unable to determine the storage system backplane speed. You might need to upgrade your software. • Drive Bays—Displays the number of drive bays provided by this storage system.
◦ Missing was Failed—A physical drive that was located in the system and had a status of failed has been removed. ◦ Missing was Predictive Failure—A physical drive that was located in the system and had a status of Predictive Failure has been removed. ◦ Missing was Offline—A physical drive that was located in the system and had a status of offline has been removed. ◦ Unknown—The Storage Agents cannot determine the status of this drive. You might need to upgrade your driver software or Storage Agents.
Drive indicators Select a SCSI physical drive from the SCSI controller submenu to display information on actions to take when a SCSI physical drive is not operating properly. Use the Predictive Indicators to predict that a drive is now operating normally, might need to be replaced. The numerical data associated with these items displays after the item name. For example, “Used Realloc: 122” indicates that there are 122 used reallocation sectors for this drive.
• Failure Indicator—Use this utility to determine the cause of failure for a failed drive. If the drive has failed and this counter is non-zero, replace the drive. If the drive condition is OK and the failure indicator is not zero, the drive might have an intermittent problem and you might have to replace it. There is no other corrective action for this error. • Self-Test Errors—Displays the number of times that a physical drive failed its self-test.
number of errors is counted from the time shown in the Service Hours item in the SCSI Physical Drive section. Having a large number of retry corrected errors does not necessarily indicate that the drive is failing. However, as a precaution, you might wish to replace a drive that has an abnormally high amount of errors when compared to similar drives. If this count increases rapidly, you might need to replace the drive. • Seek Errors—Displays the number of seek errors that a physical drive detects.
◦ Recovering—The logical drive is using Interim Recovery Mode. In Interim Recovery Mode, at least one physical drive has failed, but the logical drive’s fault tolerance mode lets the logical drive continue to operate with no data loss. You should replace the failed drive as soon as possible. ◦ Ready for Rebuild—The logical drive is ready for Automatic Data Recovery. The physical drive that failed has been replaced, but the logical drive is still operating in Interim Recovery Mode.
• Percent Rebuild Complete—Displays the percent complete of the resynchronization of the data. When the value reaches 100, the rebuilding process is complete. The logical drive continues to operate with slightly reduced performance during the rebuild. This value is only active when the logical drive has a status of Rebuilding. • OS Assigned Name—Displays the operating system name associated with this logical drive. Physical drives A list of physical drives that are members of this logical drive.
• • • Physical Width—Displays the actual width of the data transfer bus for this device. The following values are valid: ◦ Narrow (8 bits)—The device supports a narrow 8-bit data transfer bus. ◦ Wide (16 bits)—The device supports a wide 16-bit data transfer bus. ◦ Unknown—The Storage Agents are unable to determine the physical data transfer width for this device. Current Width—Displays the width of the data transfer bus that was negotiated between the controller and the device.
• SAS Logical Drive • SAS Tape Drive • SAS Storage System SAS Host Bus Adapter Select a host bus adapter entry from the Mass Storage list to display the following information: • Model—Displays the HBA's model ID, used for identification purposes. • Status—Displays the current status of the HBA. The following values are valid: ◦ OK—The host bus adapter is operating normally. ◦ Failed—The host bus adapter has failed and is no longer operating.
◦ Missing-Was Offline—Indicates a physical drive that was located in the system and had a status of offline has been removed. ◦ Solid State Disk Wear Out—Indicates that the solid state drive has a S.M.A.R.T wear error and is approaching the maximum usage limit for writes (wear out). The solid state drive should be replaced as soon as possible. ◦ Missing - Was Solid State Disk Wear Out —Indicates that a physical drive that was located in the system and had a status of SSD wear out has been removed.
• Media Type—Indicates the type of media the physical drive is composed of. The following values are valid: ◦ Rotating Platters—The physical drive media is composed of rotating platters. ◦ Solid State—The physical drive media is composed of solid state electronics. ◦ Unknown—The Storage Agents cannot determine the media type. • SAS Address—Displays the SAS address assigned to this disk drive. This item can be used for identification purposes.
• • ◦ Offline—The logical drive is offline and cannot be accessed by the operating system. User action may be required to bring the drive back online. ◦ Unknown—The Storage Agents cannot determine the status of this drive. You may need to upgrade your driver software or Storage Agents. Raid Level—Displays the raid configuration of the logical drive. The possible values are: ◦ RAID 0–Fault tolerance is not enabled. If a physical drive reports an error, the data cannot be recovered.
SAS Tape Drive Select a SAS tape drive from the SAS host bus adapter sub-menu to display the following information: • Model—Displays the model of the SAS tape drive. • Status—Shows the status of the tape drive selected. ◦ OK—The tape drive is operating normally. ◦ Offline—The tape drive is offline and can no longer return data. No further status is available. ◦ Unknown—The Storage Agents cannot determine the status of this tape drive. You may need to upgrade your driver software or Storage Agents.
• • ◦ Unknown - The Storage Agents do not recognize the status of the fan subsystem. You may need to upgrade your software. ◦ No Fan - This storage system does not have a fan. Power Supply Status displays the status of the redundant power supply. The following values are possible: ◦ OK - All component power supplies that make up the redundant power supply are in normal working order. ◦ Degraded - One of the component power supplies that make up the redundant power supply has failed.
iSCSI Storage Connections Select an iSCSI Instance entry from the Storage list to display instance and portal information and a submenu containing separate entries for Node, Session, and Connection information. The following items may be displayed: • iSCSI Instance Information • Session Information • Connection Information iSCSI Instance Information Select an iSCSI Instance entry from the Storage list to display details about that iSCSI instance.
◦ IPv4z - The address is an IP version 4 address with a zone index. ◦ IPv6z - The address is an IP version 6 address with a zone index. ◦ DNS - The address is a DNS domain name. ◦ Unknown - The address is empty or the address type is unknown. • Address displays the portal IP address. • Portal Tag displays the portal aggregation tag value.
• Number Connections displays the number of transport protocol connections that currently belong to this session. • Maximum R2T displays the maximum number of outstanding request-to-transmit (R2T)s per task within this session. • Error Recovery Level displays the level of error recovery negotiated between the initiator and the target. Higher numbers represent more detailed recovery schemes. • Data Sequence in Order indicates the iSCSI data PDU transfer order.
• Protocol displays the transport protocol over which this connection is running. The following values are valid: ◦ IPv4 - The address is an IP version 4 address. ◦ IPv6 - The address is an IP version 6 address. ◦ IPv4z - The address is an IP version 4 address with a zone index. ◦ IPv6z - The address is an IP version 6 address with a zone index. ◦ DNS - The address is a DNS domain name. ◦ Unknown - The address is empty or the address type is unknown.
Sub-system Classification Power Subsystem This section displays information about the redundant power supplies. The following entries may be displayed: 112 • Location—Displays the bay where the power supply is located. • Condition—Displays the status of the power supply. The following values are possible: ◦ OK—A power supply is installed and operating normally. ◦ Failed—A power supply is installed and is no longer operating. Replace the power supply.
• Used Capacity (%)—Represents the current power supply capacity which is a percentage of its maximum capacity. • Used Capacity (W)—Represents the current power supply capacity in watts. • Max Capacity—Represents the maximum capacity of the power supply in watts. • Model—Represents the power supply model name. • Voltage—Represents the Input Main Voltage of the power supply in volts. • Redundancy State—Represents the redundancy state of the power supply.
Temperature Sensors Information • Temperature condition—Displays the current temperature condition of the system or client PC. This value can be: ◦ OK—The temperature is within normal operating range. ◦ Degraded—The temperature is above normal for airflow obstructions. Make sure that the cover is on. CAUTION: Do not operate the system with the cover removed. Proper airflow is possible only when the cover is in place and properly secured.
◦ Failed—A non-redundant fan has failed. The device shuts down automatically to prevent damage to hardware or data loss. Replace the fan. ◦ Unknown—You may need to upgrade your driver software or Server Agents and the Server Agent cannot determine the status of this setting. • Location—This specifies the location of the fault tolerant fan present in the system. • Type—This specifies the type of the fan. This value can be: • Present—This specifies if the fault tolerant fan is present in the system.
Advanced Memory Protection (AMP) This section displays the following information about the Advanced Memory Protection sub-system. • • 116 AMP Mode Status—Displays status of the Advanced Memory Protection sub-system. The following states are supported: ◦ Other / Unknown—The system does not support Advanced Memory Protection or the Management Agent cannot determine the status. ◦ Not Protected—This system supports Advanced Memory Protection but the feature is disabled.
• ◦ Advanced ECC—This system can be configured for the Advanced ECC type of Advanced Memory Protection. ◦ Mirroring (deprecated)—This system can be configured for Mirrored Advanced Memory Protection. ◦ Online Spare—This system can be configured for Online Spare Advanced Memory Protection. ◦ LockStep—This system can be configured for LockStep Advanced Memory Protection. ◦ None—This system can not be configured for Advanced Memory Protection.
• ◦ CPU Number—This displays the CPU number to which the memory DIMMs are installed. ◦ Riser Number—This displays the riser number to which the memory DIMMs are installed. Status—This provides the current status of the Advanced Memory Protection memory board or cartridge or riser. The following status values are supported: ◦ Unknown—The value is unsupported or could not be determined. ◦ OK—The board or cartridge is configured and operating correctly.
• Type—Displays the type of memory installed. • Other—Memory type can not be determined. • Board—The value determine the memory module is permanently mounted (not modular) on a system board or memory expansion board.
• Cache—Displays the amount of device or client hardware cache available. For example, Cache L2: 64KB indicates 64 KB of secondary level cache between the processor and system memory. • Action—Indicates what action, if any, should be taken for the currently selected processor. Possible values include No Action Needed and Replace CPU. • Step—Displays the revision level of the processor.
• Bytes—Displays the number of bytes transmitted/received. • Total Packets—Displays the number of packets transmitted/received. • Unicast Packets—Displays the number of unicast packets transmitted/received. • Non-Unicast Packets—Displays the number of non-unicast packets transmitted/received. • Discarded Packets—Displays the number of packets discarded during transmit/receive. • Error Packets—Displays the number of error packets found during transmit/receive.
Power • Auxiliary Power—Displays whether or not the auxiliary power (External Power Cable and/or Internal Power Cable, which is a 30-pin cable or a 16-pin cable) is connected to the Remote Insight. • Virtual Power Button—Displays whether or not the virtual power button cable is connected to the Remote Insight. Modem/COM Port Settings NOTE: The Modem/COM Port Settings is not supported for Integrated Lights-Out Edition or The Remote Insight Lights Out Edition.
Self Test Results The Self Test Results section indicates various error-status depending on the Remote Insight model.
critical threshold. The bar is red if the disk space usage is above the critical threshold. The unused space on the volume is displayed in gray. Disk Space Usage Thresholds The disk space usage threshold values are displayed inside triangular shaped indicators above the disk space usage bar graph. A yellow indicator is used for the warning threshold and a red indicator is used for the critical threshold.
• Free Space %—Ratio of the free space available on the logical disk unit to the total usable space provided by the selected logical disk drive. • Queue Length—Average number of both read and write requests that were queued for the selected disk during the sample interval. • Disk Busy Time % (Thresholds Supported)—Percentage of elapsed time that the selected disk drive is servicing read or write requests. Processors • CPU—Name of the processor for which statistical information is gathered.
thread that consumes cycles when no other threads are ready to run. It can be viewed as the percentage of the sample interval spent doing useful work. This counter displays the average percentage of busy time observed during the sample interval. It is calculated by monitoring the time, the service was inactive, and then subtracting that value from 100%. Server System Health • System Up Time—Elapsed time (in seconds) that the computer has been running since it was last started.
• Context Block Queue/sec—Rate per second at which the work context blocks must be placed on the FSP queue of the server to await server action. • % Total PageFile Usage (Thresholds Supported) —Amount in percent of the Page File instance in use. For details, see the Process Object: Page File Bytes information. • Available KBytes —Amount of physical memory available to processes running on the computer. It is calculated by summing space on the Zeroed, Free, and Stand-by memory lists.
• Page Faults/sec—Overall rate at which the faulted pages are handled by the processor. It is measured in numbers of pages faulted per second. A page fault occurs when a process requires code or data that is not in its working set (its space in physical memory). This counter includes both hard faults (those that require disk access) and soft faults (where the faulted page is found elsewhere in physical memory). Most processors can handle large numbers of soft faults without consequence.
possible. Since the requests are queued by the Network Driver Interface Specification or NDIS in this implementation, this length is always set to zero. • Packet Outbound Errors—Number of outbound packets that could not be transmitted because of errors. • Packet Receive Errors—Number of inbound packets that contained errors preventing them from being deliverable to a higher-layer protocol. • Current Bandwidth (Mbits/sec)—Estimate of the current bandwidth of the interface in megabits per second.
this count. On multi-processor machines, the maximum value of the counter is 100 % times the number of processors. • % Privileged CPU Time—Percentage of elapsed time that the threads of the process have spent executing code in privileged mode. When a Windows NT system service is called, the service often runs in privileged mode to gain access to system-private data. Such data is protected from access by threads executing in user mode.
• Last Reset—Displays how the last server reset was performed. The following values are possible: ◦ ASR—The last reset was performed by ASR. Check the Critical Error Log to determine what may have caused ASR. ◦ ASR-Cleared—The last reset was performed by ASR. The degraded condition caused by the ASR reset has been cleared. Degraded ASR conditions can be cleared by selecting the Clear ASR button on the Auto Server Recovery window. ◦ Manual—The last reset was performed manually.
Pager • Pager Status—Displays the status of the pager. If a modem is installed in the server and paging is enabled, ASR can send an alarm to a pager when a critical error occurs. The status can be the following: • Enabled—Paging will occur. • Disabled—Paging will not occur. • Unknown—You may need to upgrade your support software or Server Agents or the Server Agent cannot determine the status of this pager.
• Remote ROM-based Diagnostics—Displays the date of the current Remote ROM-based Diagnostics for this device. This field shows NA if Remote ROM-based Diagnostics are not present. • Hours in Service—Displays the number of hours the operating system has been running on this device since the operating system software was installed. • Serial Number—Displays the Physical serial number of the device or client system board. Use this number for identification and registration purposes.
Memory This section displays the following information about the Device memory information: • Total Memory [KB] —The total amount of memory available on the device or client PC, such as 8192 KB. • Correctable Memory—Memory errors are corrected by the Error Correcting Code (ECC) memory subsystem when they occur. The Correctable Memory field displays the status of the Correctable Memory as one of the following. • Logging—ECC memory correction is supported and error logging is enabled.
• Mirrored memory with dual memory boards—This system is configured for Mirrored Advanced Memory Protection within a dual memory board configuration. The mirrored memory may be swapped with memory on the same memory board or with memory on the second memory board. • Mirrored Memory within a single memory board—This system is configured for Mirrored Advanced Memory Protection within a single memory board.
• Memory in Use—This value specifies the size of memory for this board or cartridge as seen by the OS. • Advanced Memory Protection Condition—displays the current condition of the Advanced Memory Protection subsystem. The following states are supported: ◦ Other—The system does not support fault tolerant memory or the Management Agent cannot determine the state. ◦ OK—This system is operating normally. ◦ Degraded— The Advanced Memory Protection sub-system has been engaged.
• Universal Serial Bus Port—This section displays the Universal Serial Bus (USB) ports that have been enabled for this unit. Following information is displayed in the USB table: • ◦ Port—displays the USB port numbers. ◦ Device Description—displays the device name when the USB device is attached to the port. ◦ Status—displays the status of the USB device whether it is Present or Absent or N/A. Default value is displayed as N/A against each available ports on this machine.
• DMA Channels—The DMA channel displays, followed by the slot number of the board that is using this channel. • Memory—The memory range displays, followed by the slot number of the board that is using this memory. NOTE: A slot number of "system" in the device, or “embedded” in the client workstation, refers to slot zero. System Summary HP System Insight Manager automatically collects configuration information for all devices in the Responsible Device List.
• Monitor Model displays the monitor model. Use this item for identification purposes. • Monitor Serial Number displays the serial number for the monitor. Use this number for identification purposes. • Monitor Manufacture Date displays the monitor's date of manufacture date Enclosure Information If your system is a blade server based system, the navigation frame displays the Enclosure Information link under the Configuration section.
• Serial Number • Part Number • Spare Part Number • Firmware Revision • Max Power Output • Current Power Output • Intake Temperature • Exhaust Temperature • Status • Server Enclosure • Indicates the condition of the power sub-system for the power chassis, along with the redundancy state and load balance state. • General Information • Information about Power Enclosure have been listed below.
• Present • Enclosure Network Connector • Name • Model • Serial Number • Part Number • Spare Part Number • Firmware Revision • Type • Location • Present NOTE: The iLO driver and the Rack Management Dispatch Service must be installed for the Rack Information sub-agent to communicate with the rack infrastructure.
• • • • 142 ◦ SystemUpTime ◦ TotalThreads CPQ_Server ◦ AccessPermissionErrors ◦ ContextBlockQueueRate ◦ GrantedAccessErrors ◦ LogonErrors ◦ ServerSessions ◦ SessionsErroredOut ◦ TotalByteRate CPQ_Processor ◦ CpuTimePercent ◦ CpuUserTimePercent ◦ InterruptRate ◦ PercentDPCTime ◦ PercentInterruptTime ◦ PrivelegedCpuTimePercent ◦ Processor CPQ_Memory ◦ AvailableKBytes ◦ CacheBytes ◦ CacheFaultRate ◦ PageFaultRate ◦ PageInputRate ◦ PageOutputRate ◦ PageRate
• • • • CPQ_Cache ◦ CopyReadHitsPercent ◦ CopyReadRate CPQ_PhysicalDisk ◦ CurrentDiskQueueLength ◦ DiskBytesPersec ◦ DiskQueueLength ◦ DiskReadBytesPersec ◦ DiskReadsPersec ◦ DiskTimePercent ◦ DiskTransfersPersec ◦ DiskWriteBytesPersec ◦ DiskWritesPersec ◦ PhysicalDisk CPQ_LogicalDisk ◦ DiskQueueLength ◦ DiskTimePercent ◦ FreeMegabytes ◦ FreeSpacePercent ◦ LogicalDisk CPQ_NetworkInterface ◦ BytesReceivedPersec ◦ BytesSentPersec ◦ CurrentBandwidth ◦ NetworkInt
• • CPQ_Tcp (CPQ_Tcpv4 for Windows Server 2003) ◦ ConnectionFailures ◦ ConnectionsActive ◦ ConnectionsEstablished ◦ SegmentsRate ◦ SegmentsRetransmitRate CPQ_Process ◦ CpuTimePercent ◦ PageFaultRate ◦ PageFileBytes ◦ PrivateBytes ◦ PrivelegedTimePercent ◦ Process ◦ ThreadCount ◦ WorkingSet Under Windows Server 2003, the formatted data is also available under the WMI CIMV2 namespace as: • Namespace: root\CIMv2 • Subclasses of CIM_StatisticalInformation\Win32_Perf\Win32_PerfFo
• ASR Extended Memory Parity Error—The system detected a data error in extended memory following a reset because an ASR timeout. • ASR Memory Parity Error—The system ROM was unable to allocate enough memory to create a stack. It was unable to put a message on the screen or continue booting the server. • ASR Reset Limit Reached—The maximum number of system resets has been reached. The System Configuration utilities are loaded. • ASR Reset Occurred—No error data is logged.
• NMI-System Concurrency Error—A potential error condition was detected within the Data Flow Manager, resulting in a system failure. • NMI-Uncorrectable Memory Error—The device experienced an uncorrectable memory parity error resulting in a device failure. • NMI-Unknown Error Type—The device driver does not recognize this NMI. The health driver might need to be updated. • Processor Failure—The processor failed during the POST.
IMPORTANT: To be able to mark log entries as corrected, agents must have sets enabled and the SNMP Community string must be correct. IMPORTANT: The Monitor and Control community strings for the device is required. The HP Insight Management Agents and HP Systems Insight Manager uses these community strings to communicate with the OS SNMP service.
3 Subsystem specific to a NetWare operating system Operating system overview HP now provides operating system management for NetWare environments. The NetWare operating system information is displayed when the server being monitored running NetWare 4.x or NetWare 5.0 with Novell NetWare Management Agent.
• System Time—The date and time kept by this server. • Up Time—The time (in hundredths of a second) since this server was last restarted. • User Count—The number of entries in the User Account Table. Only the operator and administrator have the right to retrieve this information. • Logged-In Users—The number of licensed connections (logins) in this file server. Only the operator and administrator have the right to retrieve this information.
User Information page The User Information page lists all user accounts in this file server. Users in the table might or might not be logged in at the time the page is viewed. The page is divided into two sections: General Information and User Information. General information The General Information section displays the following information: • User Count—The number of entries in the User Account Table. • Logged-In Users—The number of licensed connections (logins) in this file server.
Table 3-4 Available status conditions Need security change Audit connection recorded MacStation DS audit connection recorded Connection abort Logout in progress • Address (sortable)—The transport address and domain of the connection. • Connection Time (sortable)—The date and time the connection was established. Loaded NLMs page The Loaded NLMs page is sorted by loaded order by default.
• TimeOffset—In the format of +/- XX:XX:XX (hour:minute:second). To do a set, modify the value in the predefined format in the text field, and click SET. • BlockShift—An integer typeset. Modify the value in the text field, and click SET. • Trigger—An integer typeset. Modify the value in the text field, and click SET. In NetWare 4.x, all the sets done through command line or Monitor utility take effect immediately, but the sets are lost when the server is rebooted.
4 CR3500 RAID Array SCSI controller Mass storage RAID Array This section displays RAID array information. Five banners appear in this section. RAID array status • • Status—Displays the status of the RAID array. The following conditions are valid: ◦ Good—The RAID array is fully operational. ◦ Reduced—The RAID array is operating in a degraded or reduced state. One or more of the physical drives that make up the RAID array are either missing or failed.
Physical Drive status • The following conditions are valid: • On Line—The drive attached to this channel is a fully-functional member of this RAID set. • Off Line—The drive attached to this channel is not a member of the RAID set. • Hot Spare—The drive attached to this channel is kept spinning whenever the controller is powered up. It is to be automatically brought online to replace a failed drive. • Warm Spare—The drive attached to this channel is not spun up until a disk in the array fails.
I/O response over the RAID set creation. A rate above 50 puts a higher priority on the RAID set creation at the expense of I/O activity. • Cache Size—Displays the cache size in megabytes. • DIMM A Size—Displays the Dual Inline Memory Module A size in megabytes. • DIMM B Size—Displays the Dual Inline Memory Module B size in megabytes . Mass Storage Summary CR3500 Shared Storage system This section displays degraded or failed devices in the CR3500 Shared Storage system.
External Expansion Cabinet This section displays the External Expansion Cabinet information. The following conditions are valid: • • • 156 Power Supply Status—Displays the current status. The following conditions are valid: ◦ OK—All power supply parameters are normal. ◦ Non-Critical—The redundant power supply is reporting a fault that is not critical to operation. ◦ Not Installed—One of the redundant power supplies has been removed. ◦ Unknown—The power supply information is unavailable.
Support and other resources Information to collect before contacting HP Be sure to have the following information available before you contact HP: • Software product name • Hardware product model number • Operating system type and version • Applicable error message • Third-party hardware and software • Technical support registration number (if applicable) How to contact HP Use the following methods to contact HP technical support: • In the United States, see the Customer Service / Contact HP Un
HP authorized resellers For the name of the nearest HP authorized reseller, see the following sources: • In the United States, see the HP U.S. service location website: http://www.hp.com/service_locator • In other locations, see the Contact HP worldwide website: http://welcome.hp.com/country/us/en/wwcontact.html Documentation feedback HP welcomes your feedback. To make comments and suggestions about product documentation, send a message to: mailto:docsfeedback@hp.
Replaceable The name of a placeholder that you replace with an actual value. [] In command syntax statements, these characters enclose optional content. {} In command syntax statements, these characters enclose required content. | The character that separates items in a linear list of choices. ... Indicates that the preceding element can be repeated one or more times. WARNING An alert that calls attention to important information that, if not understood or followed, results in personal injury.
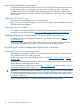
A Troubleshooting Insight Management Agents for servers issues Inability to perform remote reboot on a server from the Management Console 1. Load CPQAGIN. 2. Verify that Remote Reboot is enabled. 3. Verify that Sets are enabled.
1. 2. Select Edit Preferences>Advanced (expand)>Cache. Under the Compare the page in the cache to the page on the network heading, select the every time I view the page radio button. NOTE: Enable cookies in the browser. They are required for security.
• Frame sizes are optimized for medium-sized fonts. If you switch your browser to use larger or smaller fonts, then you must manually adjust the frame layout. • A JavaScript error might occur when displaying an IML page containing a very large IML in Netscape Navigator. NOTE: A large IML does not cause an error in Internet Explorer, but it does take a long time to load (more than four minutes).
IMPORTANT: For Windows Server 2003, Windows 2000, Windows NT, NetWare 5.1, and NetWare 6.0 (SNMP Only), enter the Monitor and Control community strings for the device. The Insight Management Agents and HP Systems Insight Manager use these community strings to communicate with the OS SNMP service. Without a Control community string, certain operations cannot be performed, such as clearing the IML or changing agent configuration settings.
under Configure SNMP Service. The Insight Manager community string is set in the Device Setup window from the management console (select Device Setup from the Task List window). For more information, see “Setting Up SNMP Community Strings” in the HP Insight Manager User Guide. NOTE: 4. 5. Community strings are case-sensitive. Verify that network communications with Insight Manager are operational. Invoke the Windows ping command from an MS-DOS prompt.
Load the device driver using one of the following methods: • If an HP SCSI controller is installed in the monitored system, load the correct device driver. For details on loading the appropriate driver, see the ProLiant Support Pack for Microsoft Windows 2000 or the ProLiant Support Pack for Microsoft Windows NT 4.0. If the SCSI device is located on a SCSI controller that is not supported, such as the HP 6260 controller, the button remains disabled.
Problems if the address 127.0.0.1 is not added to SNMP host list The following problems occur only if the address 127.0.0.1 is not added to the SNMP host list if SNMP host security is used in Windows NT or Windows 2000. • The following Event Log error messages appear: The HP Foundation Agents service could not terminate agent "CPQMHOST." The data contains the error code. The HP Foundation Agents service could not start agent "CPQMHOST." The data contains the error code. • NIC information does not appear.
1. 2. Select Operation>Hardware Setup. Re-select the tape drive to use. If these actions do not eliminate the error message, the tape drive might not be functioning properly. Management Agents for servers for NetWare issues Inability to change any values on the managed system or to mark errors as corrected 1. 2. 3. Verify that the SNMP NLM was loaded with the proper community string settings .
Identifier when HP Systems Insight Manager performs an SNMP SET command to the NetWare server. 1. To remove the permanence of the Global Unique Identifier, delete the file \SYSTEM\ CPQBSSA.CFG, in the NetWare SYS volume. 2. After the file is deleted, restart the Management Agents. HP Systems Insight Manager assigns a new Global Unique Identifier when the system is discovered.
Glossary This Glossary provides the list of all the glossary terms and their definitions. A Automatic Server Recovery (ASR) A server feature designed to automatically restart the server after a critical hardware or software error. If a critical error occurs, the server records the error in the Server Health Logs, reboots the system, and pages (if a modem is installed in the server). C Client A computer connected to a server on the network.
N NetWare Loadable Module (NLM) Executables that run under the Novell NetWare operating system. NetWare Peripheral Architecture (NWPA) The goal of the NetWare Peripheral Architecture (NWPA) is to provide NetWare Version 4.x, and IntranetWare customers with broader and more reliable driver support for host adapters and storage devices.
Index A L accounts user, 11 Adapter Information Page, 152 array controllers, 20 ASR POST failure, 166 authorized resellers, 157 Loaded NLMs Page, 151 logging in, 13 logical drives, 33 logs critical errors, 144 integrated management, 25 B M browser requirements, 9 Management HTTP Server, 12 C NetWare community string settings, 167 NetWare Loaded Modules, 148 network interface controller , 120 nodes cluster, 28 ntegrated management log server agents, 146 Client data collection configuration, 27 comm
typographic conventions, 158 U update service registering, 157 User Information Page, 150 V values inability to change,, 167 W warranty, 157 Web-enabled Management Agents troubleshooting, 166 WEBAGENT.