
Software for Linux Owner's manual
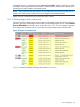

cpu iowait Reports the percentage of time the system was waiting for I/O to complete
or to handle an interrupt.
cpu system Shows how much of the CPU time was spent on system-level tasks.
cpu usage Reports how much of the managed system's CPU set was spent in the
user, system, and nice states. This is the default view.
load average Reports the 1, 5, and 15 minute load averages.
mem buffers Shows how much of the managed system's memory is allocated to
system-wide memory buffers.
mem shared Reports the amount of memory shared among applications.
mem used Reports the percentage of memory in use for all activities, for example,
code, buffers, and shared memory.
swap info Reports the amount of swap space available and the amount of swap
space in use.
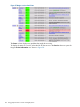
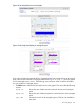
• The Last menu specifies the length of the sample data. The choices are as follows:
◦ 1 month◦ 1 week◦ 1 day◦ 6 hours◦ 1 hour
◦ ◦◦◦◦2 hours 1 year2 weeks2 days12 hours
• The Sorted menu specifies how to sort the detail graphs. The options are as follows:
Displays those managed systems with the greatest data first.ascending
by hostname Displays the managed systems by host name regardless of the data.
descending Displays those managed systems with the least data first.
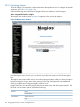
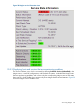
• The System Details link opens the Nagios Service Status Details for All Hosts window.
• Selecting the Get Fresh Data button in the top right-hand corner updates the graph with any
available new data.
NOTES:
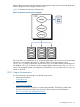
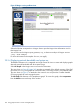
• The detail graphs for a system show the graphs for a specified metric on all Nagios hosts.
The detail graphs for a Nagios host show metrics for that Nagios host.
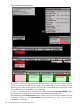
• Certain graphs might appear empty because the data graphed is an insignificant percentage
of the total. This can occur because the measurements under normal operation can often be
1% or less of the total. This can be the case for mem buffers and mem shared, for instance.
170 Using graphical tools to monitor managed systems