
Instruction Manual

Generating an SQL queries list
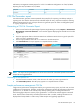
1. From the System Summary Report screen, select the server for which you want to generate a list.
2. Click Show SQL queries. The SQL query appears in a separate browser window.
Sample performance management System Summary report
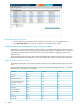
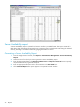
System Summary reports are created in a browser window in a printable format. The report has two sections.
The first section consists of a table showing what percentage of time each server subsystem was in a bottleneck
state during the selected interval. This table provides a convenient method for gauging the performance
health of a server.
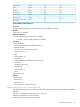
The second section of the summary report includes a detailed system configuration listing. This is the same
information available for each component in the Online Analysis. This section is not applicable to VM Guests.
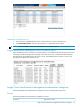
System Summary report for a server
The subsequent paragraphs in this section provides a description of the System Summary report of a typical
server.
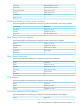
Performance management Summary Report for 172.20.60.134, Hardware Configuration as of 11/04/2009.
Reporting from 11/02/2009 to 11/04/2009.
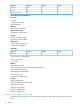
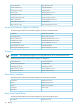
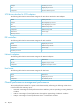
% Major% Minor% NormalSubsystem
0.00.0100.0Processors
0.00.0100.0Memory
0.00.0100.0Network Connections
0.00.0100.0NC7782 Integrated 1000T
Gigabit Server Adapter
0.00.0100.0Port ID: 1
0.00.0100.0Host Buses
0.00.0100.0Compatibility Bus
00.0100.0Compatibility Bus
0.00.0100.0Bus 6
0.00.0100.0Primary Bus
0.00.0100.0Primary Bus
32 Reports