
Owner manual

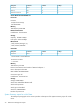

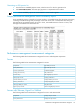

IDE controllers
The following table lists the measurement categories for IDE controllers.
Megabytes per secondModel
Milliseconds per transferController ID
Queue lengthSample time
—Transfers per second
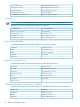
Network adapters
The following table lists the measurement categories for Network adapters.
PerformanceModel
Megabits sent per secondPCI slot
Megabits received per secondSample time
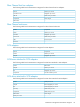
Host buses
The following table lists the measurement categories for host buses.
PerformanceDevice
Megabytes per secondName
Bus utilization percentSample time
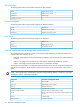
Overall performance management performance
The overall performance status for a system can be determined by referencing the following values shown
in the first half of the summary report:
• %Normal—Percentage of overall performance that is satisfactory with no impending or existing bottleneck
condition
• %Minor—Percentage of overall performance that might be approaching a bottleneck condition
• %Major—Percentage of overall performance that is in a bottleneck condition
The following table describes the configuration details and performance status for components analyzed by
performance management. The appropriate components are shown in the second section of the summary
report.
NOTE: When performance management is unable to analyze and log data for a component, the values
of %Normal, %Minor, and %Major might be 0.
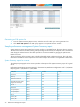
Table 5-1 Performance management overall performance summary
Description and configuration detailsComponents
Server modelsServer
All individual processor modelsProcessors
Total physical memoryMemory
Overall network connections
Network card base adapter (PCI slot number)
Port ID number belonging to the network card base adapter (NIC
model)
Network Connections
Network Card Base Adapter
Port ID
Overall storageStorage
Overall shared storageShared Storage
40 Performance Management reports