
Owner manual


Generating an SQL queries list
1. From the Server Availability Report screen, select the server for which to generate a list.
2. Click Show SQL Queries. The SQL query appears in a separate browser window.
NOTE: Server availability reports are not available for virtual machine guests.
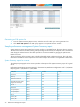
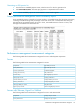
Sample performance management Server Availability report
Server Availability report is created in a browser window in a printable format. The report has one section,
consisting of a table showing what percentage of time each server was in a bottleneck state during the
selected interval, Accessible Duration of Server in hours, Inaccessible Duration of Server in hours, and
Average of each Metrics for selected servers.
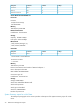
Performance management measurement categories
The following tables list the measurement categories for servers and subsystem components.
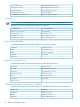
Servers
The following table list the measurement categories for servers.
Page faults per secondSample time
Page reads per secondServer performance
Available MegabytesProcessor performance
NIC performanceAverage processor busy
NIC Megabytes per secondProcessor busy
Storage performanceInterrupts per second
Storage transfers per secondContext switches per second
Storage Megabytes per secondMemory performance
PCI performanceHard page faults per second
Host bus Megabytes per secondPages input per second
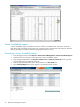
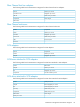
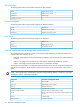
Servers with VMware, Hyper-V or VMHost
The following table lists the measurement categories for servers with VMware ESX.
Storage read per secondSample time
Storage write per secondServer performance
Performance management measurement categories 37