HP Insight Control performance management User Guide HP Part Number: 598216-001 Published: January 2010 Edition: 1
© Copyright 2003 - 2009 Hewlett-Packard Development Company, L.P. Legal Notices Confidential computer software. Valid license from HP required for possession, use or copying. Consistent with FAR 12.211 and 12.212, Commercial Computer Software, Computer Software Documentation, and Technical Data for Commercial Items are licensed to the U.S. Government under vendor's standard commercial license. The information contained herein is subject to change without notice.
Table of Contents 1 Introduction...............................................................................................9 Overview...............................................................................................................................................9 Structure..............................................................................................................................................10 Features....................................................................
Generating a Static Analysis Report...................................................................................................30 Generating an SQL queries list.....................................................................................................30 Sample performance management Static Analysis report.......................................................................30 System Summary report..............................................................................................
Server metrics.......................................................................................................................................51 Server status....................................................................................................................................51 Server inventory...............................................................................................................................51 Processors........................................................
Fibre Channel Host Bus Adapter Inventory...........................................................................................61 Network storage controller.....................................................................................................................61 Network Storage Controller Status......................................................................................................62 Network Storage Controller Inventory..........................................................
List of Tables 5-1 6-1 6-2 6-3 6-4 6-5 6-6 Performance management overall performance summary.....................................................................40 Installation and uninstallation issues...................................................................................................43 HP SIM integration..........................................................................................................................43 Performance management license administration issues...........
1 Introduction Overview HP Insight Control performance management is a software solution that detects and analyzes hardware bottlenecks on HP ProLiant servers and HP Integrity servers. Performance management provides the tools needed to receive proactive notification of impending bottleneck conditions and debug existing performance issues. With Insight Control performance management, performance can be monitored on one or more servers.
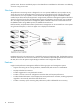
problem areas. The Server Availability report in the HTML format consolidates the information on availability of servers at any point in time. Structure The performance monitoring service is designed to run on a separate middle-tier server (analysis server), which also serves as the HP Insight Control console server and performs the bulk of the processing. The monitored servers are only required to run the standard HP Management Agents and WBEM Providers, installed as part of the HP ProLiant Support Pack.
2 Licensing Overview This chapter provides information about licensing servers for use with performance management. In the earlier releases of performance management, servers were licensed using the License Manager and the Unlicensed System page. Starting with the Insight Software 6.0 DVD release, licensing the servers procedures are different than the earlier versions.
NOTE: An HP SIM-discovered and licensed server does not appear in the Monitoring Administration page if the server discovered is not a valid ProLiant server in HP SIM or the server is not of a supported configuration. To resolve: 1. Rediscover the server in HP SIM using the correct management protocol and valid SNMP community strings or WBEM credentials. 2. Verify the product name and operating system information on the system page of the server.
5. 6. 7. Click Add Licenses. The Add Licenses pane appears. Enter an available license key. License keys are located on the sticker included with the performance management license kit. Click OK. The added license is displayed in the Licenses page. Applying licenses to a server To apply licenses to a server, complete the following steps: 1. 2. 3. 4. Select the server you want to license. From the HP Insight Control console toolbar, select Configure > Managed System Setup wizard.
3 Monitoring using the HP Insight Control performance management Overview This chapter provides an overview of the complete performance management functionality.
Monitoring Administration page This page lists the number of discovered and licensed servers. The server list includes all of the licensed servers by name, model, IP address, monitor status, mode of operation, sample rate, and number of samples. The default monitoring status and number of samples values are assigned to a server when it is monitored. The Monitoring Administration page also allows you to change the monitoring parameters of the monitored servers.
1. 2. 3. 4. Monitor - This mode enables server status monitoring, updating information that HP SIM and HP Insight Control performance management display. You can view the analysis information using the Online Analysis tool. Monitor & Alert - This mode, in addition to the capabilities enabled with Monitor, sends alerts to HP SIM when the status of a server changes.
NOTE: You cannot delete the logged data of a server for the same day or the same date. The data needs to be logged in for a minimum of 24 hours before deleting the logged-in data for the server. 4. To remove the data from the performance management database, click Delete Selected Data. Enabling virtual machine host and virtual machine guests logging Virtual machine guests that are configured on the virtual machine host currently being monitored are not automatically monitored.
1. 2. 3. 4. 5. From the HP Insight Control console toolbar, select Options→Performance Management→Monitoring Administration. The Monitoring Administration page appears in a new window. Select the Server tab. Servers or virtual machine hosts and virtual machine guests available for monitoring appear in the list. Select the virtual machine guest for which to change monitoring parameters. To select all the items listed on the page, select the checkbox at the top of the column.
4 Analyzing the server performance Overview This chapter provides you with the various tools available in the performance management for analysis of the monitored servers and also discusses the different options available for analyzing the information logged/available for the servers.
Click the monitored server icon on the PF column. • Perform the following steps: 1. From the Insight Control/Insight Dynamics console toolbar, click Diagnose→Performance Management→Online Analysis. 2. Select the checkbox next to the server or servers for which to view performance data. The checkbox at the top of the column can be used to select all of the servers listed on the page. 3. Click Apply Selections→Run Now. The Online Analysis page appears in a new window.
• To the next sample • Forward to the next bottleneck • To the latest sample Performing Offline Analysis The Offline Analysis tool enables performance data to be viewed from a database that has been captured and logged over a specified time. The Offline Analysis tool enables you to view recorded data sessions from the performance management database. To use Offline Analysis: 1. 2. 3. 4. 5.
Reading the analysis information The subsequent sections discuss the various methods of reading the analysis information.
Expanding the local storage To expand the tree structure for the storage component, click the + icon next to Storage in the configuration tree, and then select the storage node. The graphical representation is as displayed in the following figure. Displaying the controller To display the tree structure for the Smart Array 6i controller, click the + icon next to Smart Array 6i controller in the configuration tree. The arrays defined for that controller and the SCSI bus entries (ports) appear.
Displaying the port To display the tree structure for the storage system port: 1. 2. Click the + icon next to SCSI Port 2 in the configuration tree. Scroll the pane to the right to display the Port Enclosure status. The graphical representation is as displayed in the following figure. Displaying the drive Click the ID 1: 16GU3 15K( LD1 ) drive. The graph displays the performance statistics for that drive over the duration shown in the screenshot.
Displaying the inventory To display information for the selected drive, select the Inventory tab. The graphical representation is as displayed in the following figure. Hardware or configuration details for the currently selected device appear.
5 Performance Management reports Overview The Insight Control performance management can generate reports illustrating the percentage of time a system was in a bottleneck state and the overall performance utilization for a system categorized by its components. A System Summary report can be generated from data in the performance database in HTML format. CSV File Generator can generate comma-separated value (CSV) files for import into desktop analysis or reporting tools.
Generating a Static Analysis Report 1. 2. 3. 4. From the Insight Control console Reports→Performance Management→Static Analysis Report Select the server for which you want to generate a Static Analysis report. Enter the appropriate dates in the Report on Data From and Report on Data To boxes to get the period for which you want to generate the report. Leave these boxes blank to generate a report from the current performance data. Click Generate Report. The report appears in a separate browser window.
System Summary report System Summary reports are created in a browser window in a printable format. The report has two sections. The first section consists of a table showing what percentage of time each server subsystem was in a bottleneck state during the selected interval. This table provides a convenient method for gauging the performance health of a server. The second section of the summary report includes a detailed system configuration listing.
Generating an SQL queries list 1. 2. From the System Summary Report screen, select the server for which you want to generate a list. Click Show SQL queries. The SQL query appears in a separate browser window. Sample performance management System Summary report System Summary reports are created in a browser window in a printable format. The report has two sections.
Secondary Bus 100.0 0.0 0.0 Bus 5 100.0 0.0 0.0 Storage 100.0 0.0 0.0 Smart Array 6i 100.0 0.0 0.0 Drive Array: A 100.0 0.0 0.0 Physical Disk: 0 100.0 0.0 0.0 SA SCSI Enclosure: Internal Drive Cage 100.0 0.0 0.0 Server Model: ProLiant DL380 G4 Processors Intel Xeon 2.8-GHz4 MByte L2 Cache 2.8 GHz with 4.
Subsystem % Normal % Minor % Major Processors 100.0 0 0 Memory 100 0 0 Network Connections 100 0 0 Server Model: ProLiant BL460c G1 Processors Processor 2 Physical Processor(s) CPU MHz 2666 Memory Total Memory: 2046 MB Network Connections IP Addresses: 172.24.38.69 Storage Capacity: 137984.0 MByte Free Space: 16533.0 MByte Mount Points /vmfs/volumes/Storage1 (3) /vmfs/volumes/SAN-ESX Guest SSR Subsystem % Normal % Minor % Major Processors 100.
Performance management Summary Report for 131.111.1.73 Hardware Configuration as of 03/16/2004 Reporting from 03/16/2004 to 03/19/2004 Subsystem % Normal % Minor % Major Processors 96.0 4.0 0 CSV File Generator report CSV File Generator generates comma-separated value (CSV) files for importing into desktop analysis or reporting tools. The CSV file documents each individual sample for every component analyzed, collecting different measurements for each.
Server Availability report A Server Availability report is created in a browser window in printable format. This report consists of a table listing what percentage of time each server component was in a bottleneck state during the selected interval, providing a convenient method for gauging the health of a server. Generating a Server Availability Report 1. 2. 3. 4. 5. 36 From the Insight Control console Reports→Performance Management→Server Availability Report.
Generating an SQL queries list 1. 2. From the Server Availability Report screen, select the server for which to generate a list. Click Show SQL Queries. The SQL query appears in a separate browser window. NOTE: Server availability reports are not available for virtual machine guests. Sample performance management Server Availability report Server Availability report is created in a browser window in a printable format.
Processor performance NIC Megabits Received per second Average processor busy NIC Megabits Received per second Available Megabytes Storage Megabytes per second NIC Megabytes per second Available Megabytes NIC Megabits Transmitted per second Network Megabytes per second VM guest IMPORTANT: The measurement categories are not applicable for the server with VMware ESX Host.
Fibre Channel host bus adapters The following table lists the measurement categories for Fibre Channel host bus adapters. PCI slot Transfers per second Controller model Megabytes per second HBA ID Milliseconds per transfer Sample time Queue length Performance — Fibre Channel enclosures The following table lists the measurement categories for Fibre Channel enclosures.
IDE controllers The following table lists the measurement categories for IDE controllers. Model Megabytes per second Controller ID Milliseconds per transfer Sample time Queue length Transfers per second — Network adapters The following table lists the measurement categories for Network adapters. Model Performance PCI slot Megabits sent per second Sample time Megabits received per second Host buses The following table lists the measurement categories for host buses.
Smart Array controller Smart Array controller model (PCI slot number) • Array Configured array • External enclosure • Logical drive number (Windows Physical Disk number) • Internal drive cage • External enclosure connected to the controller • Bus number, Drive ID, Size, SCSI drive model • Internal drive cage connected to the controller • Bus number, Drive ID, Size, SCSI drive model SCSI adapter SCSI adapter model Internal drive cage Internal drive cage connected to the adapter Bus numb
6 Troubleshooting the Insight Control performance management Overview This chapter identifies and provides solutions for commonly encountered setup and installation problems.
Issue Occurs when After the performance management The PMPTools.xml file is not executed installation, the performance management properly during HP SIM and performance menu might not appear on the HP SIM management integration. console. Solution Add the performance management menu manually. To manually add the performance management menu, perform either of the following procedures: • From the command line, enter: mxtool –a –f “:\Insight Control performance management\PMPTools.
Issue Occurs when Solution While attempting to monitor a virtual host, When the virtual host is not licensed and the PF column displays a critical icon for managed by VMM. the virtual host. To ensure that the Virtual Host is registered and licensed to VMM, complete the following procedure: 1. Select the host server on the All Systems page. 2. Click Deploy on the All Systems page. 3. Select License Manager, and then click Virtual Machine Management. 4. Click Manage License, and then select license. 5.
Table 6-5 Windows Server 2003/2008 issues Issue Occurs when Solution When accessing HP SIM for the first time The site is not accepted as a trusted site by Add the site to the trusted zone. Be aware on a Windows Server 2003/2008 system, the security settings. that it lowers the security settings for all the following message appears: content on the HP SIM pages. Content from Web site listed below is being blocked by Internet Explorer security configuration.
Support and other resources Information to collect before contacting HP Be sure to have the following information available before you contact HP: • Software product name • Hardware product model number • Operating system type and version • Applicable error message • Third-party hardware or software • Technical support registration number (if applicable) How to contact HP Use the following methods to contact HP technical support: • In the United States, see the Customer Service / Contact HP Uni
HP authorized resellers For the name of the nearest HP authorized reseller, see the following sources: • In the United States, see the HP U.S. service locator website: http://www.hp.com/service_locator • In other locations, see the Contact HP worldwide website: http://welcome.hp.com/country/us/en/wwcontact.html Documentation feedback HP welcomes your feedback. To make comments and suggestions about product documentation, send a message to: docsfeedback@hp.
WARNING CAUTION IMPORTANT NOTE TIP An alert that calls attention to important information that, if not understood or followed, results in personal injury. An alert that calls attention to important information that, if not understood or followed, results in data loss, data corruption, or damage to hardware or software. An alert that calls attention to essential information. An alert that contains additional or supplementary information. An alert that provides helpful information.
A HP Insight Control performance management measurement parameter matrix This appendix details the measurement parameters evaluated by the performance management component for the various components of a system configuration. A brief description of each parameter that appears, in both the Status and Inventory view, is provided. Server metrics The following information is provided for server metrics.
are busy, the metric reads 25%. Average Processor Busy % can be viewed as the fraction of the time spent doing useful work. Each processor is assigned an idle thread in the idle process consuming unproductive processor cycles not used by another thread. Some processors might be more heavily loaded than other processors. In this case, the total processor time percentage is the average of the loads on each processor.
Memory Inventory • • System Memory • Displays the physical memory installed in the server • Displays the amount of memory that can be addressed by the operating system • Displays any server-specific memory technology or configurations Memory Board—Describes the configuration of the memory boards and lists the number of DIMMs configured in each particular DIMM socket and any empty sockets Network connections The following information is provided for network connections.
Network Port Status • MBytes/Sec—The average number of megabytes transferred (transmitted or received) over the NIC port each second. • MBits TX/Sec—The average number of megabits transmitted from the selected NIC port each second. • MBits RX/Sec—The average number of megabits received by the selected NIC port each second. • TX Utilization %—The percentage of data that is transmitted from the selected NIC port. This value is calculated from the TX MBits/Sec and the operating speed of the NIC port.
Smart Array Controller Status • Transfers/Sec—The number of requests between the server and this IDE Smart Array controller each second • MBytes/Sec—The sum of all megabytes transferred (read and written) between the server and this Smart Array controller each second • Millisec/Transfer—The average time for each request to complete • Queue Length—The average number of concurrent requests between the server and this Smart Array controller, including transfers currently being serviced and transfers wai
Drive Array Status • Reads/Sec—The number of reads from each drive in the drive array each second • Writes/Sec—The number of writes to each drive in the drive array each second • Read MBytes/Sec—The average number of megabytes read from each drive in the drive array each second • Write MBytes/Sec—The average number of megabytes written to each drive in the drive array each second • Millisec/Read—The average time for each read to complete • Millisec/Write—The average time for each write to complet
Smart Array SCSI Drive Status • Disk Reads/Sec—The number of reads from the drive each second • Disk Writes/Sec—The number of writes to the drive each second • Disk Read MBytes/Sec—The number of megabytes read from the drive each second • Disk Write MBytes/Sec—The number of megabytes written to the drive each second • Disk Millisec/Read—The average time for each read to complete • Disk Millisec/Write—The average time for each write to complete • Disk Queue Length—The average number of concurren
SATA Drive Inventory • • Drive Information • Displays description of the drive, including size • Displays the hard drive model number • Displays the exact size of the drive as seen by the operating system Configuration Information • Provides a summary of the drive configuration • Displays the name of the Smart Array controller to which it is attached • Displays the location of the hard drive in its enclosure • Displays the array in which the drive is configured • Provides the SATA protocol
SCSI Drive Status • Disk Reads/Sec—The average number of reads from the selected SCSI drive each second • Disk Writes/Sec—The average number of writes to the selected SCSI drive each second • Disk Read MBytes/Sec—The average number of megabytes read from the selected SCSI drive each second • Disk Write MBytes/Sec—The average number of megabytes written to the selected SCSI drive each second • Disk Millisec/Read—The average time required to complete a read • Disk Millisec/Write—The average time re
SCSI storage enclosure performance is determined by the SCSI Utilization %.
ATA disk The following information is provided for an ATA disk.
Network Storage Controller Status • Transfer/Sec—The average number of transfers (reads and writes) on this network storage controller each second • MBytes/Sec—The average number of megabytes transferred on this network storage controller each second • Millisec/Transfer—The average time to complete a transfer to and from the selected network storage controller • Queue Length—The average number of transfer requests (reads and writes) waiting to be serviced by the network storage controller • Port Ut
Network Share Inventory Logical Drive Configuration • Displays the total capacity of the drive • Displays the network storage enclosure in which the selected logical drive is located • Displays the RAID level for this logical drive External storage enclosure The following information is provided for an external storage enclosure.
Network Storage Enclosure Inventory • Enclosure Configuration—Displays the type or model, name, and serial number of the network storage enclosure. • Controllers—Displays the name and model of the enclosure and whether it is operating with redundant controllers. • • If a redundant controller is configured, then both standby and active controllers are listed. • If redundancy is not configured, only active controllers are listed. Detected Servers—Displays a list of servers sharing the enclosure.
NOTE: Performance management does not accurately report the negotiated PCI bus protocol when unknown PCI devices with slower transfer rates than the controller are configured on the same bus.
B HP Insight Control performance management - Bottleneck Scenarios This appendix identifies and provides solutions for some bottleneck scenarios encountered while using Insight Control performance management. Bottleneck Scenarios Analyzing a network storage bottleneck condition The following sections detail the appropriate responses when a bottleneck condition exists on network storage.
The Analysis Explanation indicates that the storage components are operating normally within recommended ranges. Displaying the logical drive under network storage The logical drives and their performance characteristics are displayed on the left tree and by clicking on the listed logical drive the details of the subsystems can be obtained. Displaying the array In the tree frame, the array information and important array counters are displayed.
Analyzing a server bottleneck condition The following sections discuss the appropriate actions to take when a bottleneck condition exists on a server. In this scenario, the server name is pmpserver. Selecting the server To display the performance management Online Analysis window for performance management server, click the Major icon. The screen displays the server tree in the left navigation pane and the Status tab in the right pane.
The Analysis Explanation details an above-average page-read rate (higher than 30% of the hard page fault), and less than configured memory threshold. The analysis recommends more physical memory to handle the load. Many recommendations suggest adding hardware. In this example, the situation might have occurred because a new batch job was assigned to run on the server at night.
The pattern of the graph shows rising, peaking, and declining, which might be caused by the completion of the new batch job. The batch job no longer causes a problem. However, the performance information is logged in the database for later review with the Offline Analysis tool. Analyzing a virtual machine host and guest bottleneck condition The following sections detail the appropriate actions to take when a bottleneck condition exists on virtual machine hosts and guests.
The Analysis Explanation indicates that the virtual machine host includes the performance of the virtual machine guests. Displaying the virtual machine guests page From the navigation tree, to access the virtual machine guest and to display the status page in the right panel, click the associated virtual machine guests tree. Related and important counters for the virtual machine guest appear in the Analysis Data table.
In this example, the Analysis Explanation indicates that at least one component has a critical performance issue. Displaying the virtual machine guest performance From the navigation tree, click on the respective VM guest subcomponents to get the performance parameters for the VM guest components being monitored by performance management. In this example, the Analysis Explanation indicates that components of VM vmgurest2 are operating normally.
This recommendation indicates that more than one logical processor exists in the system and at least one processor is not fully utilized. This recommendation demonstrates not only a solution without involving hardware, but also the specificity of performance management. Online Analysis recommendations for these types of performance issues are component-specific. Performing a static analysis The following sections provide examples of using static analysis.
Performing a static analysis 75
Glossary agent A program that regularly gathers information or performs some other service without the user's immediate presence. HP SIM agents provide in-depth hardware and software information and subsystem status to HP SIM and numerous third-party management applications. See also management agent. enclosure A physical container for a set of server blades. It consists of a backplane that routes power and communication signals and additional hardware for cabling and thermal issues.
for Network Management of TCP/IP-based internets (MIB-II) is the standard information available consistently across all vendors. Web-Based Enterprise Management (WBEM) 78 Glossary This industry initiative provides management of systems, networks, users, and applications across multiple vendor environments. WBEM simplifies system management, providing better access to software and hardware data that is readable by WBEM client applications.
Index A R analysis offline, 22 online, 21 report CSV file generator, 35 performance management, 29 server availability, 36 static analysis, 29 system summary, 31 C CSV file generator report, 35 D display controller, 25 graphical, 24 inventory, 27 port, 26 G generating CSV file generator report, 35 server availability report, 36 static analysis report, 30 system summary report, 31 I S server configuration, 24 set performance monitoring parameters, 16 setting performance threshold, 17 static analysis