HP Insight Control Performance Management 7.
© Copyright 2004–2012 Hewlett-Packard Development Company, L.P. Legal Notices Confidential computer software. Valid license from HP required for possession, use or copying. Consistent with FAR 12.211 and 12.212, Commercial Computer Software, Computer Software Documentation, and Technical Data for Commercial Items are licensed to the U.S. Government under vendor's standard commercial license. The information contained herein is subject to change without notice.
Contents 1 Introduction...............................................................................................7 Overview................................................................................................................................7 Structure..................................................................................................................................8 Protocol settings................................................................................................
Generating a Static Analysis Report.....................................................................................26 Generating an SQL queries list........................................................................................26 Sample Performance Management Static Analysis report.........................................................26 System Summary report...........................................................................................................
A Measurement parameter matrix..................................................................47 Server metrics........................................................................................................................47 Server status......................................................................................................................47 Server inventory.................................................................................................................
IDE Controller Inventory......................................................................................................57 ATA disk................................................................................................................................58 ATA Disk Status.................................................................................................................58 ATA Disk Inventory...............................................................................................
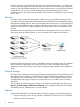
1 Introduction Overview HP Insight Control performance management detects, analyzes, and explains hardware configuration issues and performance bottlenecks on HP ProLiant servers, virtual machines, and MSA shared storage. Insight Control performance management provides the tools required to receive proactive notification of building bottleneck conditions and to debug existing performance issues. With Insight Control performance management, performance can be monitored on one or more servers.
Summary report can be generated from the data in the performance database in an HTML format. A CSV File Generator generates comma-separated value (CSV) files for importing into desktop for analysis or onto other different reporting tools. A Static Analysis report is an analysis of the hardware configuration for the server as a whole, identifying the potential problem areas. The Server Availability report in the HTML format consolidates the information on availability of servers at any point in time.
• Provides suggestions for every bottleneck situation. • Provides a concise overview of configuration anomalies that could impact performance. • Provides detailed information on the subsystem that causes performance constraints, enabling pinpointed upgrades to economically extend the useful life of server. • Provides a summary report containing both performance profile and detailed server inventory.
2 Licensing Overview This chapter provides information about licensing servers for use with Performance Management. In the earlier releases of Performance Management, servers were licensed using the License Manager and the Unlicensed System page. Starting with the Insight Management 6.0 DVD release, licensing the servers procedures are different than the earlier versions.
Licensing Insight Control performance management using HP SIM license manager Insight Control performance management licenses can be added to the Performance Management database and deployed on an individual server using the HP SIM License Manager. NOTE: An HP SIM-discovered and licensed server does not appear in the Monitoring Administration page if the server discovered is not a valid ProLiant server in HP SIM or the server is not of a supported configuration. To resolve: 1.
1. 2. From the HP Insight Control console toolbar, select Configure→Managed System Setup wizard. The Introduction page appears. Click Next. The Select Features page appears. The list of features that can be configured for the systems is listed in Select Features page. 3. 4. 5. 6. 7. 8. Select HP Insight Control and click Next. The Choose Options page appears. Click Next. The Analyze System page appears displaying the results of the selected system whether licensed or not licensed. Click Next.
3 Monitoring the server performance Overview This chapter provides an overview of the complete Performance Management functionality.
Monitoring Administration page The Monitoring Administration page lists the number of discovered and licensed servers. The server list includes all of the licensed servers by name, model, IP address, monitor status, mode of operation, sample rate, and number of samples. The default monitoring status and number of sample values are assigned to a server when it is monitored. The Monitoring Administration page also allows you to change the monitoring parameters of the monitored servers.
Insight Control performance management monitoring operates in four modes: 1. Monitor - This mode enables server status monitoring, updating information that HP SIM and HP Insight Control performance management display. You can view the analysis information using the Online Analysis tool. 2. Monitor & Alert - This mode, in addition to the capabilities enabled with Monitor, sends alerts to HP SIM when the status of a server changes. 3.
WARNING! When the property is set to a value greater than 150, the Systems Insight Manager (HP SIM) crashes leading to a Denial-of-Service (DOS) to all the SIM based functionality. Manual Log Purge page Manual Log Purge enables the recorded sessions for a logged server, logged in the Performance Management database and occupying hard disk storage space, to be deleted. Use this tool regularly to remove older recorded sessions and reduce database size.
To enable logging for virtual machine guests: 1. From the HP Insight Control console toolbar, select Options→Performance Management→Monitoring Administration. The Monitoring Administration page appears in a new window. 2. Select the Server tab. Servers or virtual machine hosts and virtual machine guests available for monitoring appear in the list. 3. Select the virtual machine guest for which to change monitoring parameters.
4 Analyzing the server performance Overview This chapter provides you with the various tools available in the Performance Management for analysis of the monitored servers and also discusses the different options available for analyzing the information logged/available for the servers.
To open the Online Analysis page, choose either of the following options: • From the Insight Control/Insight Dynamics console, click on All Systems page. The All Systems page appears. Click the monitored server icon on the PF column. • Perform the following steps: 1. From the Insight Control/Insight Dynamics console toolbar, click Diagnose→Performance Management→Online Analysis. 2. Select the checkbox next to the server or servers for which to view performance data.
Performing Offline Analysis The Offline Analysis tool enables performance data to be viewed from a database that has been captured and logged over a specified time. The Offline Analysis tool enables you to view recorded data sessions from the Performance Management database. To use Offline Analysis: 1. From the Insight Control/Insight Dynamics console toolbar, click Diagnose→Performance Management→Offline Analysis. 2.
• Samples for Status - Displays the number of samples averaged to determine system performance status • Alert - Indicates if alerts are to be sent when certain server performance status conditions occur • Log - Indicates if the performance data is currently being logged for the selected server • Set Threshold - Provides a link for modifying the performance threshold values for the selected server NOTE: The Set Threshold link is available only on the Online Analysis page.
Displaying the controller To display the tree structure for the Smart Array 6i controller, click the + icon next to Smart Array 6i controller in the configuration tree. The arrays defined for that controller and the SCSI bus entries (ports) appear. The graphical representation is as displayed in the following figure. Displaying the port To display the tree structure for the storage system port: 1. Click the + icon next to SCSI Port 2 in the configuration tree. 2.
Displaying the drive Click the ID 1: 16GU3 15K( LD1 ) drive. The graph displays the performance statistics for that drive over the duration shown in the screenshot. The graphical representation is as displayed in the following figure. Displaying the inventory To display information for the selected drive, select the Inventory tab.
Hardware or configuration details for the currently selected device appear.
5 Reports Overview The Insight Control performance management can generate reports illustrating the percentage of time a system was in a bottleneck state and the overall performance utilization for a system categorized by its components. A System Summary report can be generated from data in the performance database in HTML format. CSV File Generator can generate comma-separated value (CSV) files for import into desktop analysis or reporting tools.
Generating a Static Analysis Report 1. 2. 3. 4. From the Insight Control console, click Reports→Performance Management→Static Analysis Report Select the server for which you want to generate a Static Analysis report. Enter the appropriate dates in the Report on Data From and Report on Data To boxes to get the period for which you want to generate the report. Leave these boxes blank to generate a report from the current performance data. Click Generate Report.
System Summary report System Summary reports are created in a browser window in a printable format. The report has two sections. The first section consists of a table showing what percentage of time each server subsystem was in a bottleneck state during the selected interval. This table provides a convenient method for gauging the performance health of a server. The second section of the summary report includes a detailed system configuration listing.
Generating an SQL queries list 1. 2. From the System Summary Report screen, select the server for which you want to generate a list. Click Show SQL queries. The SQL query appears in a separate browser window. Sample Performance Management System Summary report System Summary reports are created in a browser window in a printable format. The report has two sections.
Primary Bus 100.0 0.0 0.0 Primary Bus 100.0 0.0 0.0 Secondary Bus 100.0 0.0 0.0 Bus 5 100.0 0.0 0.0 Storage 100.0 0.0 0.0 Smart Array 6i 100.0 0.0 0.0 Drive Array: A 100.0 0.0 0.0 Physical Disk: 0 100.0 0.0 0.0 SA SCSI Enclosure: Internal Drive Cage 100.0 0.0 0.0 Server Model: ProLiant DL380 G4 Processors Intel Xeon 2.8-GHz4 MByte L2 Cache 2.8 GHz with 4.
System Summary report for a VMware ESX Host The subsequent paragraphs in this section provides a description of the System Summary report for a VMWare ESX Host. Performance management Summary Report for 131.111.1.72 Hardware Configuration as of 03/16/2004 Reporting from 03/16/2004 to 03/19/2004 Subsystem % Normal % Minor % Major Processors 100.
Storage 12288 MByte VDisk name WIN2K8-64bitVM.vmdk VDisk mode persistent VDisk type scsi-hardDisk VDisk size 12884901888 Number of partitions 0 System Summary report for a VM Guest The subsequent paragraphs in this section provides a description of the System Summary report for a VM Guest. Performance management Summary Report for 131.111.1.73 Hardware Configuration as of 03/16/2004 Reporting from 03/16/2004 to 03/19/2004 Subsystem % Normal % Minor % Major Processors 96.0 4.
NOTE: The report can be generated for one server at a time and for a maximum period of one month even if the total logged duration is more. Generating an SQL queries list 1. 2. From the CSV File Generator screen, select the server for which you want to generate a list. Click Show SQL queries. The SQL query appears in a separate browser window.
Server Availability report A Server Availability report is created in a browser window in printable format. This report consists of a table listing what percentage of time each server component was in a bottleneck state during the selected interval, providing a convenient method for gauging the health of a server. Generating a Server Availability Report 1. 2. 3. 4. 5. From the Insight Control console, click Reports→Performance Management→Server Availability Report.
Generating an SQL queries list 1. 2. From the Server Availability Report screen, select the server for which to generate a list. Click Show SQL Queries. The SQL query appears in a separate browser window. NOTE: Server availability reports are not available for virtual machine guests. Sample Performance Management Server Availability report Server Availability report is created in a browser window in a printable format.
Servers with VMware, Hyper-V or VMHost The following table lists the measurement categories for servers with VMware ESX. Sample time Storage read per second Server performance Storage write per second Processor performance NIC Megabits Received per second Average processor busy NIC Megabits Received per second Available Megabytes Storage Megabytes per second NIC Megabytes per second Available Megabytes NIC Megabits Transmitted per second Network Megabytes per second VM guest IMPORTANT: Host.
SCSI buses attached to Smart Array controllers The following table lists the measurement categories for SCSI buses attached to Smart Array controllers. Enclosure type Performance Controller ID Transfers per second SCSI bus Megabytes per second Sample time SCSI bus utilization percent Fibre Channel host bus adapters The following table lists the measurement categories for Fibre Channel host bus adapters.
SCSI drives attached to SCSI adapters The following table lists the measurement categories for SCSI drives attached to SCSI adapters. Model Writes per second Adapter Read Megabytes per second Bus Write Megabytes per second Drive bay Milliseconds per read Sample time Milliseconds per write Performance Queue length Reads per second — IDE controllers The following table lists the measurement categories for IDE controllers.
NOTE: When Performance Management is unable to analyze and log data for a component, the values of %Normal, %Minor, and %Major might be 0.
6 Troubleshooting Overview This chapter identifies and provides solutions for commonly encountered setup and installation problems.
Table 3 Systems Insight Manager integration (continued) Issue Occurs when Solution performance management\PMPTools.xml” Execute the command mxconfigrefresh from the command line interface. • Copy PMPTools.xml from :\Insight Control performance management\ to :\Systems Insight Manager\Setup. Execute the command mxconfigrefresh from the command line interface.
Table 4 Insight Control performance management license administration issues (continued) Issue Occurs when Solution 4. Click Manage License, and then select license. 5. Click Apply License tab. 6. Select the Host server from Verify Target System table and then click Next. 7. Select the Host server from Assigning Licenses table and then click Apply License Now. 8. The particular paid license is assigned to the selected Host server. 9. Click Configure, and then select Virtual Machine Host Registration. 10.
Windows Server 2003/2008 issues The following table describes issues and solutions that can be associated with Windows Server 2003/2008. Table 6 Windows Server 2003/2008 issues Issue Occurs when Solution When accessing HP SIM for the first time on a Windows Server 2003/2008 system, the following message appears: The site is not accepted as a trusted site by the security settings. Add the site to the trusted zone. Be aware that it lowers the security settings for all content on the HP SIM pages.
Internet Explorer issues The following table describes issues and solutions that can be associated with Internet Explorer. Table 7 Internet Explorer issues Issue Occurs when Solution When accessing the Manual Log Purge from Internet Explorer, Internet Explorer script error pops up on Manual Log Purge home page interrupting to proceed further. This behavior occurs when a large number of servers are selected for licensing or monitoring.
7 Support and other resources Information to collect before contacting HP Be sure to have the following information available before you contact HP: • Software product name • Hardware product model number • Operating system type and version • Applicable error message • Third-party hardware or software • Technical support registration number (if applicable) How to contact HP Use the following methods to contact HP technical support: • See the Contact HP worldwide website: http://www.hp.
Warranty information HP will replace defective delivery media for a period of 90 days from the date of purchase. This warranty applies to all Insight Management products. HP authorized resellers For the name of the nearest HP authorized reseller, see the following sources: • In the United States, see the HP U.S. service locator website: http://www.hp.com/service_locator • In other locations, see the Contact HP worldwide website: http://www.hp.
Term A term or phrase that is defined in the body text of the document, not in a glossary. User input Indicates commands and text that you type exactly as shown. Replaceable The name of a placeholder that you replace with an actual value. [] In command syntax statements, these characters enclose optional content. {} In command syntax statements, these characters enclose required content. | The character that separates items in a linear list of choices. ...
A Measurement parameter matrix This appendix details the measurement parameters evaluated by the Performance Management component for the various components of a system configuration. A brief description of each parameter that appears, in both the Status and Inventory view, is provided. Server metrics The following information is provided for server metrics.
processors. In this case, the total processor time percentage is the average of the loads on each processor. • Busiest Processor Utilization %—The average utilization of the logical processor with the highest utilization. This value is equal to the Average Processor Utilization % if the server is using one processor core. • Processor Busy %—The percentage of time that the processor is executing a non-idle thread.
Memory Inventory • System Memory ◦ Displays the physical memory installed in the server ◦ Displays the amount of memory that can be addressed by the operating system ◦ Displays any server-specific memory technology or configurations • Memory Board—Describes the configuration of the memory boards and lists the number of DIMMs configured in each particular DIMM socket and any empty sockets • Memory Configuration recommendations- Displays server specific memory recommendations (for G7 servers and abo
Network Adapter Inventory • NIC Configuration ◦ Displays the name and location of the network adapter ◦ Displays the supported and negotiated PCI protocol (bus speed) of the network adapter ◦ Lists the number of ports on the NIC adapter, including any upgrade modules installed on the network adapter • NIC Ports—Displays all IP addresses assigned to the network ports • Network Teams—The state of all the ports on all network adapters Network port The following information is provided for a network
Storage Status • Storage Transfers/Sec—The number of PCI bus transfers to and from storage each second • Storage MBytes/Sec—The average number of megabytes transferred (read and written) on the storage each second Storage Inventory • Windows/Linux Logical Disks—Lists all of the logical disks in the storage subsystem and identifies their associated drive letter, file system, disk drive size (in MB), and percentage of space used • Windows/Linux Physical Disks—Lists all of the physical disks in the stor
• Millisec/Transfer—The average time for each request to complete • Queue Length—The average number of concurrent requests between the server and this SCSI adapter, including transfers currently being serviced and transfers waiting for service, regardless of where the request is waiting (drive or adapter) SCSI adapter performance is based on the performance of the SCSI disks attached to the adapter and the SCSI buses used to attach the disks to the adapter.
• Millisec/Write—The average time for each write to complete • Queue Length—The average number of concurrent requests between the server and this logical drive, including transfers currently being serviced and transfers waiting for service, regardless of where the request is waiting (disk or controller) Logical Drive Inventory Logical Drive Configuration • The controller on which the logical drive is defined • The array label (such as A, B, or C) as shown by the Array Configuration Utility (ACU) •
SATA Drive Status • Disk Read/Sec—The average number of reads from the selected SATA drive each second • Disk Write/Sec—The average number of writes to the selected SATA drive each second • Disk Read Mbytes/Sec—The average number of Megabytes of data read from the selected SATA drive each second • Disk Write Mbytes/Sec—The average number of Megabytes of data written to the selected SATA drive each second • Disk Millisec/Read—The average time required to complete a read operation • Disk Millisec/W
• Disk Millisecond/Write—The average time required to complete a write operation • Disk Queue Length—The average number of transfer requests (reads and writes) waiting to be serviced by the SAS drive, including transfers currently being serviced and transfers waiting for service, regardless of where the request is waiting (drive or controller) Insight Control performance management uses a set of algorithms to determine the SAS drive status. The Disk Queue Length is a primary parameter.
SCSI Drive Inventory • • Drive Information ◦ Displays a description of the drive, including the size ◦ Displays the hard drive model number ◦ Displays the exact size of the drive as seen by the operating system Configuration Information ◦ Provides a summary of the drive configuration ◦ Displays the name of the Smart Array controller to which it is attached ◦ Displays the location of the hard drive in its enclosure ◦ Displays the array in which the drive is configured ◦ Provides the SCSI pro
SCSI Storage Enclosure Inventory • Enclosure Configuration ◦ The type or model of the storage enclosure ◦ Which SCSI protocol is supported by the storage enclosure ◦ The number of drive bays provided by the storage enclosure ◦ The number of SCSI drives installed in the storage enclosure ◦ The SCSI adapter attached to the storage enclosure and the port on the adapter IDE channel The following information is provided for an IDE channel.
ATA disk The following information is provided for an ATA disk.
Network Storage Controller Status • Transfer/Sec—The average number of transfers (reads and writes) on this network storage controller each second • MBytes/Sec—The average number of megabytes transferred on this network storage controller each second • Millisec/Transfer—The average time to complete a transfer to and from the selected network storage controller • Queue Length—The average number of transfer requests (reads and writes) waiting to be serviced by the network storage controller • Port Ut
• Millisec/Read—The average time required to complete a read operation • Millisec/Write—The average time required to complete a write operation • Queue Length—The average number of transfer requests (reads and writes) that are waiting to be serviced by the logical drive Network Share Inventory Logical Drive Configuration • Displays the total capacity of the drive • Displays the network storage enclosure in which the selected logical drive is located • Displays the RAID level for this logical driv
Network Storage Enclosure Inventory • Enclosure Configuration—Displays the type or model, name, and serial number of the network storage enclosure. • Controllers—Displays the name and model of the enclosure and whether it is operating with redundant controllers. • ◦ If a redundant controller is configured, then both standby and active controllers are listed. ◦ If redundancy is not configured, only active controllers are listed. Detected Servers—Displays a list of servers sharing the enclosure.
NOTE: Insight Control performance management does not accurately report the negotiated PCI bus protocol when unknown PCI devices with slower transfer rates than the controller are configured on the same bus.
B Bottleneck scenarios This appendix identifies and provides solutions for some bottleneck scenarios encountered while using Insight Control performance management. Analyzing a network storage bottleneck condition The following sections detail the appropriate responses when a bottleneck condition exists on network storage. Selecting the server To display the Performance Management Online Analysis window for the monitored server, click the Major icon on Monitoring Administration page.
In the Server Configuration frame, to access the storage information and display the storage status page in the Results frame, select Storage. Related and important storage counters appear in the Analysis Data table. The Analysis Explanation indicates that number of concurrent transfer exceeds the maximum number recommended.
Analyzing a server bottleneck condition The following sections discuss the appropriate actions to take when a bottleneck condition exists on a server. In this scenario, the server name is pmpserver. Selecting the server To display the Performance Management Online Analysis window for Performance Management server, click the Major icon. The screen displays the server tree in the left navigation pane and the Status tab in the right pane.
Displaying the memory status In the Server Configuration frame, to access the memory information and display the Status page for memory in the Results frame, select Memory. Related and important memory counters appear in the Analysis Data table. The Analysis Explanation details an above-average page—read rate (higher than 30% of the hard page fault), and less than configured memory threshold. The analysis recommends more physical memory to handle the load. Many recommendations suggest adding hardware.
Analyzing a virtual machine host and guest bottleneck condition The following sections detail the appropriate actions to take when a bottleneck condition exists on virtual machine hosts and guests. IMPORTANT: The virtual machine host must be licensed for HP Insight Control and the virtual machine host must be registered on the CMS before licensing and monitoring by Performance Management.
Displaying the virtual machine guests page From the navigation tree, to access the virtual machine guest and to display the status page in the right panel, click the associated virtual machine guests tree. Related and important counters for the virtual machine guest appear in the Analysis Data table." Displaying the virtual machine guest From the navigation tree, to access the virtual machine guest and display the status page in the right panel, click the associated virtual machine guests tree.
Recommendations Addressing performance issues with no hardware upgrade recommendation The following scenario provides an example of a recommendation that does not suggest additional hardware. In the following figure, a major status icon appears for the processors. Online Analysis recommends that you determine if the processing load can be distributed more evenly across the available processors.
Bottleneck scenarios
Glossary agent A program that regularly gathers information or performs some other service without the user's immediate presence. Systems Insight Manager agents provide in-depth hardware and software information and subsystem status to HP SIM and numerous third-party management applications. See also management agent. enclosure A physical container for a set of server blades. It consists of a backplane that routes power and communication signals and additional hardware for cabling and thermal issues.
information. Systems Insight Manager is built according to industry standards to manage HP and third-party infrastructure resources. Web-Based Enterprise Management (WBEM) 72 Glossary This industry initiative provides management of systems, networks, users, and applications across multiple vendor environments. WBEM simplifies system management, providing better access to software and hardware data that is readable by WBEM client applications.
Index A R analysis offline, 19 online, 18 report CSV file generator, 31 Performance Management, 25 server availability, 33 static analysis, 25 system summary, 27 C CSV file generator report, 31 D display controller, 22 graphical, 21 inventory, 23 port, 22, 23 G generating CSV file generator report, 31 server availability report, 33 static analysis report, 26 system summary report, 27 I Insight Control performance management overview, 7 S server configuration, 21 set performance monitoring parameters