
HPjmeter 4.3 User's Guide
file. Collecting both the Glance data and the GC data at the same time is very useful because you
can view all the data together in one HPjmeter console.
Data from the opened file is visible in the Glance Data (page 194) visualizer, accessible from the
Glance Adviser tab on the GC visualizer. Glance system call data is obtained from the
PROC_SYSCALL loop in Glance Plus, and is visible in the Glance System Call Data (page 198)
visualizer, accessible from the Glance System Call tab on the GC visualizer.
Collecting GC Data with Zero Preparation
Zero preparation GC data collection is a feature in the HP JDK/JRE 5.0.14 and later, 6.0.02 and
later and 7.0.00 and later. It is started from the command line by sending a signal to the JVM to
start GC data collection.
To collect GC data without interrupting an already running application, do the following from the
command line:
1. Confirm that HP JDK/JRE 5.0.14 or later, or 6.0.02 or later or 7.0.00 or later is running the
application that you want to analyze, and that no -Xverbosegc or -Xloggc option has
already been specified.
2. Locate the process ID of the running Java application.
3. Start the profiling interval. Send a signal to the JVM by typing:
kill -PROF pid or kill -21 pid
The GC data will be written to a file named java_pid.vgc in the current directory of the
JVM process.
Let the collection generated by the JVM continue for the length of time that you think will be
meaningful.
4. Stop the data collection interval by sending the same signal to the JVM:
kill -PROF pid
You can now open the saved file in the HPjmeter console and view the collected metrics.
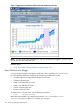
Time periods where no data is collected are shown in a light purple in all the GC graphic visualizers.
Obtaining Garbage Collection Data 99