
HPjmeter 4.3 User's Guide


6 Analyzing Garbage Collection Data
HPjmeter allows you to process garbage collection (GC) data from Java virtual machines.
Separating the GC data collection step from the analysis step has the following advantages:
• The data analysis can be done at a different time and on a different platform than was used
to run the application. For example, it can be done on a desktop system or on a laptop.
• A non-interactive agent will often impose less overhead than an interactive one.
• The data files obtained naturally facilitate comparison of different runs or creation of a history
of performance improvements.
For detailed analysis of the efficiency of garbage collection, it is useful to take a close look at
garbage collection patterns. A study of patterns of garbage collection can help you determine
whether or not the best GC type and heap size are being applied appropriately during the
application run. You can also use detailed GC data to uncover problems in the application
programming.
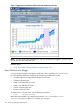
With the collection of verbose GC data, HPjmeter is able to present extensive details about the
memory usage and garbage collection (GC) exhibited when an application is running. Details are
presented in a data summary and in graphic visualizers that can be adjusted to focus on particular
aspects of the data.
Obtaining Garbage Collection Data
The -Xverbosegc option, available for the HP-UX HotSpot™ VM, was specifically designed to
produce ASCII garbage collection data files for in-depth analysis using HPjmeter.
-Xloggc can be useful for quick comparison of garbage collection behavior across different
platforms.
The GC viewer automatically opens when you open an Xverbosegc or Xloggc file from the HPjmeter
console.
Data Collection with -Xverbosegc
-Xverbosegc produces detailed information about the performance of individual garbage
collector types for the entire Java application.
To run your application with an option to capture the garbage collection information, use the
following command:
$ java ... -Xverbosegc[0|1][:file=[stdout|stderr|filename[,[n][h][d][u][t]]]]
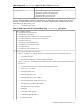
The following table lists examples of supported -Xverbosegc options for capturing garbage
collection data. This table provides information for Java 1.5.0.04. Other versions may differ from
this. HPjmeter correctly presents and labels collected data based on the Java version running with
the application. To see the complete list of available options for the Java version you are running,
use
$ java ... -Xverbosegc:help
To see the availability of HPjmeter metrics from -Xverbosegc data collection, see -Xverbosegc
and -Xloggc Options and Their Corresponding Metrics (page 101).
Table 9 Supported -Xverbosegc options for Java 1.5.0.04
0|1 0 prints after every old generation garbage collection or after a full GC.
1 prints after every garbage collection (default).
:file=[stdout|stderr|filename] stderr (default) directs output to standard error stream.
stdout directs output to standard output stream.
94 Analyzing Garbage Collection Data