
HPjmeter 4.3 User's Guide
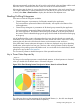

Interpreting the Histogram Presentation
You can assess the scalability of the application from the spectrum of a typical “working” thread
from your application.
• A large amount of lock contention (red) indicates that scalability will be a problem. You need
to change the inter-thread communication mechanism to reduce the lock contention.
• A large amount of waiting (green) may indicate that the load on the application can be
increased. This is because in a typical server application the threads use the Java wait method
to wait for the data to process.
• A large amount of starvation (white) indicates that the ratio of the active threads to the number
of CPUs is too large. You can probably decrease the number of threads without negatively
affecting the performance or throughput.
TIP: To best view the relative amount of starvation for a particular thread, highlight the thread
by clicking on it once, or double-click to reveal the thread pie chart for that thread. Starvation
is represented by the “empty” slice of the pie.
NOTE: Be careful when analyzing the spectrum of a thread group. A thread group may contain
several threads with completely different roles within the application. Mixing them up and analyzing
just the summary may make little sense. User-defined thread groups that contain only carefully
selected threads (usually sharing the same code) are well suited for spectrum analysis.
See also Thread Histogram (page 152)
Using Call Graph Trees
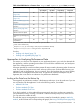
The call graph trees are used to represent metrics based on graphs. There are four metrics based
on the method call graph (showing CPU Time, Clock Time, Call Count, and Lock Delay), and two
based on object references (Reference Graph and Reference Sub-Trees by Size).
You can expand or collapse any non-leaf node by clicking on the small square on the left side of
each node.
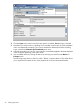
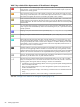
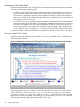
A consequence of representing a graph in the tree form is that the same graph node can be
displayed many times within the tree (showing different paths in the graph). Special color coding
of the nodes helps you to navigate the tree. Five colors are used:
Table 8 Key to Color Coding of Call Graph Nodes
Leaf. Leaf nodes, written in black, represent methods that did not call any other methods or
objects that do not keep any references to other objects. Leaf nodes cannot be expanded or
collapsed.
Expanded. After expansion the node will be shown using gray.
Expanded Elsewhere. A tree node that is already expanded elsewhere in the tree will be
shown in red.
It is possible to expand this node if you want to do so. The information shown will be identical
to that already displayed where the node is expanded. You may find that expanding the
same graph node in more than one place makes the tree less manageable.
Visited. A node that you have expanded and then collapsed is called a visited node. It is
shown in a different color (purple) to remind you that you have already looked at the contents
of this node.
Regular. All other non-leaf nodes that have not been visited are presented in blue.
See the figure below for examples.
Using Call Graph Trees 89