
HPjmeter 4.3 User's Guide
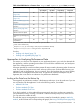
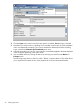
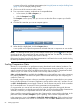
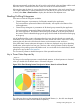
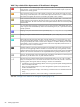
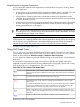
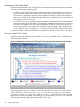

Table 7 Key to Default Color Representation of Thread States in Histograms
Lock Contention. Time wasted trying to acquire a Java lock while it was acquired by another thread.
More precisely, it is the summary time measured from the moment the thread requests a Java lock
until the lock is actually granted.
CPU. Time spent running on any of the computer's processors. This includes Java code, the native
code (if any), and the time spent in the virtual machine by this thread. If there's no Profiler Overhead
state listed in the legend, the CPU time consumed by the profiler is also included.
Profile Overhead. Estimated time used by the profiler to collect the profile data. In most cases, the
profiler overhead is proportional to the CPU time spent in Java, but also depends on the frequency
of Java method calls. This state will not be shown if the profile data file does not contain the profiler
overhead data.
I/O. Time spent while executing a synchronous input or output operation called directly from Java
code, using one of the standard library classes. This includes all types of I/O, in particular the network
(socket) operations.
Sleeping. Time spent while the thread was suspended by the java.lang.Thread.sleep method.
Waiting. Time spent while the thread was suspended by the java.lang.Object.wait method.
Native Idle. Non-CPU-consuming time spent while the thread was in a non-Java code (i.e., using
JNI). The thread could be sleeping, running a non-Java I/O operation, waiting for a child process
or being suspended by the OS for a similar reason. HPjmeter is not able to identify the exact state
of the thread in such circumstances, since the native code remains unprofiled, and the amount of
time spent in this state is always estimated.
Garbage Collection. Time spent while the thread was suspended by the virtual machine because
the (non-concurrent) garbage collector needed to run. If there are many running threads, and the
garbage collection pauses are short, this time may be larger than the actual time spent in the garbage
collector. This is because all threads must be suspended before the garbage collection may start.
Unknown. The thread state could not be determined. If the lifetime of the thread was extremely short,
HPjmeter may not be able to show any other states but Unknown.
Starvation. The time wasted while the thread was theoretically able to run (was in the “runnable”
state), but actually did not run. The reasons for starvation can be within the Java VM or within the
operating system. Most typical situations resulting in starvation are listed below:
• A traditional, non-concurrent garbage collector was running (only if the specific Garbage Collection
state is not listed) at that time.
• There were more threads ready to run (within all applications present in the system) than the
number of available CPUs.
• The operating system (for example, virtual memory) overhead or failure to schedule the threads
“fairly”
• Virtual machine operations, such as class loading, or method de-optimization.
See also: Change Color Selection for Histogram Display (page 210)
88 Profiling Applications