
HPjmeter 4.3 User's Guide
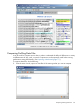
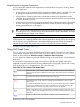

2. Click the Scope menu name to see the scope options. By default, Process scope is selected.
3. Note that if you mark an item in a profiling viewer and then switch scope, the “find immediate”
action is automatically executed. If you want to disable this default action before switching
scope, uncheck the Automatic find immediately menu item.
4. Select the scope that you want. The scope change is immediately applied to the data displayed
in the visualizers appearing in the open viewer.
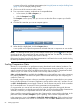
5. View available metrics by clicking the tabs or by selecting new items from the Metrics or
Estimate menus.
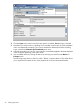
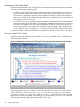
The following image shows a metric for which “Thread” scope has been set. The slider allows
you to expand and contract the two views (method call count and associated threads).
84 Profiling Applications