
HPjmeter 4.3 User's Guide
Looking at the Data from the Top Down
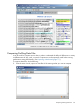
An alternative, top-down approach to profile data analysis is to start from the call graph based
on Clock or CPU time and continue expanding the topmost nodes until you find a method or multiple
methods that implement high-level operations characteristic for your application (that is, are
responsible for transaction processing). By expanding this node you can see how this high-level
operation splits its work among the methods it calls. If your intuition tells you that the numbers do
not look appropriate or correct, continue expanding the nodes that consume too much time to find
the reason for the anomaly.
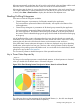
Looking for Inefficiencies in Memory Usage
Large applications put a lot of stress on all components of the computing system. One strategy for
understanding the behavior of your application is to look at how well the application is working
within the boundaries set for heap size and the selected garbage collection type in use by the
JVM. Adjusting heap size and garbage collection type can improve memory usage and work
efficiency when adjusted to the demands of a particular application. For a view of memory usage
and object metrics, see Profile Memory and/or Heap Activity (page 168). See Analyzing Garbage
Collection Data (page 94) to obtain a detailed view of the impact of GC activity on the system.
Operating system performance, third-party software performance, the bandwidth of the I/O
subsystem, and so on, all affect application performance. Analyzing these factors is beyond the
scope of this tool, but it should always remain on your agenda.
Considerations in Interpreting the Data
What information can be gleaned from various metrics depends on how the values are calculated.
Use this section to understand the meaning of the performance measures used by HPjmeter.
Inclusive Versus Exclusive Time
Exclusive time is the accumulated total time used by a method, but not including the time used by
the methods that were called from it.
Inclusive time is the accumulated total time used by all invocations of the method and all methods
that were called from it directly or indirectly. Inclusive times are useful if you want to see the cost
of a particular task performed by the application, and you can associate this task with a single
method.
However, for recursive methods, the inclusive times may not correspond well to your intuition.
When a given method calls itself directly or indirectly, the time spent in the topmost invocation of
the method is accumulated (for the purpose of inclusive times) for all active invocations of this
method. The inclusive times depend not only on the amount of work done by the method, but also
on the depth of recursion, and thus have limited value. The exclusive times for recursive methods
do not exhibit this anomaly.
Most profilers collect either the inclusive time or the exclusive time, but not both. Exclusive times
can be easily calculated from the inclusive times and the call graph information. However, converting
the times in the opposite direction usually cannot be done with 100% certainty. When a console
visualizer displays inclusive times calculated from the exclusive times, it appends “(data estimated)”
to the metric title.
Time Units
Generally, all times are expressed in some abstract time unit. The actual time units in the metrics
depend on the profiler agent used to generate the profile data and are beyond control of HPjmeter.
However, the actual time units are rarely needed to locate performance bottlenecks. Furthermore,
even though in most cases the execution times are measured by the profiler agent in milliseconds,
the profiler's intrusion can distort these times so much that the direct correspondence between the
measured time and the actual application speed (when run without profiling) is lost.
82 Profiling Applications