
HPjmeter 4.3 User's Guide
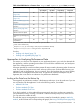
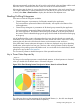
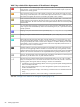
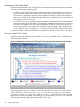

Table 6 Available Metrics or Features from -Xeprof and -agentlib:hprof Data (continued)
-agentlib:hprof-XeprofFeature
heap=sitesheap=dumpcpu=timescpu=samples
N/AN/ANoNoYesExclusive Class Clock Times*
(page 168)
N/AN/ANoNoYesExclusive Class Lock Delay*
(page 179)
N/AN/AYesNoYesInline Candidates (page 180)
heuristics
N/AN/AYesNoYesExceptions Thrown (page 180)
heuristics
NoYesN/AN/ANoMemory Leaks (page 180)
heuristics
YesYesYesN/AYes
4
Allocation sites for objects
Yes
3
N/AYes
3
Yes
3
YesPer-thread or per-thread-group
view
N/AN/ANoNoYesProfiling intrusion
compensation
1
Virtual CPU times, unless on HP-UX; some platforms report clock times
2
Metric values estimated only
3
Requires thread=y (no color-coding or start/stop times available for threads)
4
Requires inlining=disable or running the VM in interpreted mode
See also:
• Profiling with -Xeprof (page 72)
• Profiling with -agentlib:hprof (page 76)
Approaches to Analyzing Performance Data
The metrics you choose to view depend on your application domain, your code, the demands for
the application, and the operating environment. Look at all of the available ones, and analyze at
least a few of the topmost entries.
Whenever possible, the console visualizers present all metrics sorted in decreasing order of resources
used. This places the largest resource users at the top of the screen. Evaluate them knowing your
application and its characteristics. Use your intuition. If you find anything that you cannot explain,
take the time to investigate and find the cause. A high level of resource consumption may be
legitimate, but it can also be an indication of a performance bottleneck.
Looking at the Data from the Bottom Up
One approach to performance analysis is the bottom-up technique. It can be used even if you are
not very familiar with the application. Look at the following metrics, if available:
• Method Call Count
• Exclusive Method CPU Time
• Exclusive Method Clock Time
If you find a method, or a few methods that consume much time, they can become a target for
your performance tuning. Similarly, if a method is called excessively many times, check to see if
you can reduce the number of calls.
This will often require investigating the invocation context for the method in question. Mark the
method , and find it later in the corresponding call graph. (See Using Call Graph Trees (page 89)).
Approaches to Analyzing Performance Data 81