
HPjmeter 4.3 User's Guide
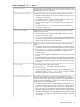
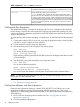
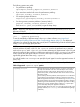
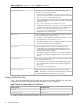
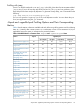
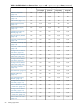

Table 4 Supported -agentlib:hprof options (continued)
Remember that a heap dump contains all objects, not just live objects
cpu=samples uses sampling as the collecting technique, while
cpu=times uses tracing with reduction.
cpu=samples|times
• Typically, the times collected by cpu=samples|times are CPU
virtual times. However, HP-UX 11i versions use real CPU times rather
than CPU virtual times unless sampling is used.
• Some implementations of cpu=times report clock time. HPjmeter tries
to figure out what times actually have been collected, but sometimes
does not do it right.
• cpu=samples and cpu=times output exclusive times.
• Collecting heap data can be very intrusive, so we recommend that
you measure the method times and heap usage at different times.
However, it may make sense to specify heap=sites and
cpu=samples|times for the same run when you want to locate
the allocation sites in the call graph.
Controls whether the stack traces collected during program execution
will be associated with an individual thread.
thread=y|n
• By default, no thread identification information is stored (thread=n).
• We suggest that you always specify thread=y.
• With the thread identification in the profile file, HPjmeter can calculate
the thread profile data for the entire application.
Controls the depth of the stack trace for each stack trace taken.depth=size
• Increasing this value will make the profile data file larger, but it
enables HPjmeter to better estimate inclusive method times and
generate more complete call graphs.
• If you measure application performance by sampling, the default
value of 4 is too small for most applications; use values between 6
and 12.
This is the cut-off value for printing the list of methods with their exclusive
times or object allocation sites.
cutoff=value
• Decreasing this value will make the profile data file slightly larger,
but it enables HPjmeter to produce more complete call graphs or
heap metrics.
• Use a value of 0 for all applications.
HPjmeter displays both ASCII and binary format of the profile file.
NOTE: Note that hprof does not list method arguments. In effect, all
overloaded methods are represented as just one method.
format=a ,format=b
Naming Profile Data Files
Table 5 shows the default file types HPjmeter uses when saving profile data files. You may want
to follow this convention when naming profile data files, but it is not required.
Table 5 Default File Name Suffixes for Profile Data
File Name SuffixProfiling Option
.eprof-Xeprof
.hprof.txt-agentlib:hprof
For other file suffixes recognized by HPjmeter, see Naming Monitoring Data Files (page 49)
78 Profiling Applications