
HPjmeter 4.3 User's Guide

The following options are useful:
• For performance profiling:
cpu=samples,thread=y,depth=10,cutoff=0,format=a
• If you must have method call counts for performance profiling:
cpu=times,thread=y,cutoff=0,format=a
• For analyzing object allocations:
heap=sites,cpu=samples,thread=y,cutoff=0,format=a
• For solving memory retention problems ("memory leaks"):
heap=all,thread=y,cutoff=0,format=a,doe=n
Then use kill -QUIT pid (on UNIX ) to get the heap dump.
NOTE: Beginning with HPjmeter version 3.1, you can view binary hprof files (format=b) in
HPjmeter visualizers.
To see the complete list of available options, use
java ... -agentlib:hprof=help
To see the availability of HPjmeter metrics from hprof data collection, see –Xeprof and
–agentlib:hprof Profiling Options and Their Corresponding Metrics (page 79). For additional
information on collecting heap dump data, see the Java™ Troubleshooting Guide for HP-UX Systems
at http://www.hp.com/go/hpux-java-docs.
NOTE:
With the addition of JVMTI in JDK 5.0, the -agentlib switch is the preferred way to activate
tools such as hprof. With -agentlib, you can take advantage of improvements in JDK 5.0 and
reduce the impact of data sampling on application performance. While -Xrunhprof can still be
used to specify the JVM agent with Java 5 versions, the impact on application performance is
significantly greater than when using -agentlib.
You will still need to use -Xrunhprof to specify the hprof agent for earlier supported versions of
Java (1.4.x).
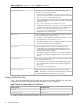
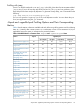
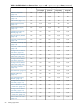
Here are the supported -agentlib:hprof options that affect the collection of profile data:
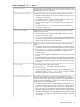
Table 4 Supported -agentlib:hprof options
The heap dump shows all objects remaining in memory at the time of
the dump. The allocation sites show where the objects were created
heap=dump|sites|all
during the execution of the program. Heap analysis can be used to
locate memory leaks, and the allocation sites can be used to minimize
the memory usage.
To solve memory retention problems, the best practice is to use the QUIT
signal rather than the application shutdown to obtain the heap dump.
When the application shuts down, some references go out of scope and
the retention problem may get eliminated just before the heap is dumped.
Send the signal at the moment that you suspect the application is holding
references to no longer needed objects. Add the doe=n hprof option
to turn off the heap dump from application shutdown.
To keep the heap dump size down, try to send the signal just after a full
garbage collection (use -verbose:gc to be notified about the garbage
collections).
Collecting Profile Data 77