
HPjmeter 4.3 User's Guide
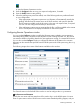
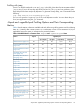
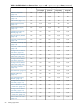

Table 3 Supported -Xeprof options (continued)
The default value for this option is enable. Another way to disable inlining is
to collect the profile data while running the VM in interpreted mode (-Xint).
Enable/disable the profiling intrusion estimation.ie=yes|no
ie=yes, the default value, specifies that the profiler estimates the profiling
intrusion and writes the estimated values to the profile data file. HPjmeter uses
this data to compensate for intrusion, which means that the estimated intrusion
is subtracted from the CPU times before they are presented to the user. Disabling
intrusion estimation slightly reduces the size of the data files, but will also disable
the intrusion compensation feature. This option has no impact on the actual
profiling overhead.
Profiling with Zero Preparation
Zero preparation profiling is a feature of the HP JDK/JRE 5.0.04. It is started from the command
line by sending a signal to the JVM to start eprof. Engaging zero preparation profiling may have
a short term impact on application performance as the JVM adjusts to the demands of performing
dynamic measurements.
To collect profiling data without interrupting your application, do the following from the command
line:
1. Confirm that a HP JDK/JRE 5.0.04 or later is running the application that you want to profile,
and that no -Xeprof option has been specified.
2. Find the process ID of the running Java application.
3. Start the profiling interval: send a signal to the JVM by typing:
kill -USR2 pid
You will see the following message:
eprof: starting profiling
Let the profiling collection generated by the JVM continue for the length of time that you think
will be meaningful.
4. Stop the profiling interval by sending the same signal to the JVM:
kill -USR2 pid
You will see the following message:
eprof: terminating profiling
writing profile data to ./filename.eprof
You can now open the saved file in the HPjmeter console and view the collected metrics.
NOTE: For the signal to be captured by the JVM, you must either be logged in as root, or you
must be the user who started the JVM.
Related Topics
• Zero Preparation Profiling (page 221)
Profiling from HPjmeter with Zero Preparation
Enhanced zero preparation profiling is a feature of HP JDK/JRE 7.0.04. Profiling can now be
started from the HPjmeter console while performing real-time monitoring of a running Java
application. To collect profiling data from the HPjmeter console without interrupting your application,
do the following:
1. Open a real time monitoring session with the JVM. See “Using HPjmeter to Monitor
Applications” (page 34).
2. Click the extended profiling button
74 Profiling Applications