
HPjmeter 4.3 User's Guide

and optimization, and the application initializations (database connections, threads, and
data structures).
◦ If the benchmark runs for too long, it will be very time consuming to repeat the run, and
you'll be tempted to make several changes to your application between the consecutive
profiling runs, which is not recommended.
• As your application grows in terms of performance, you may need to scale up your benchmark
as well.
See also
For information on how to compare data files, see Comparing Profiling Data Files (page 85) and
Scaling Comparison Data (page 86).
Collecting Profile Data
To take full advantage of HPjmeter functionality, you can gather profiling data using -Xeprof for
performance tuning and -agentlib:hprof for memory tuning when you run your application.
NOTE: If you are running the HP JDK/JRE 5.0.04 or later, you can send a signal to the running
JVM to start and stop a profiling data collection period with zero preparation and no interruption
of your application. See Profiling with Zero Preparation (page 74).
If you are running the HP JDK/JRE 7.0.04 or later, you can also use the HPjmeter console to start
and stop a profiling data collection period with no interruption of your application. See Profiling
from HPjmeter with Zero Preparation (page 74)
Profiling with -Xeprof
To profile an application, use the following command:
$ java -Xeprof:options ApplicationClassName
To profile an applet, use the following command:
$ appletviewer -J-Xeprof:options URL
where options is a list of key[=value] arguments separated by commas.
You can also stop the JVM (kill pid) or control the profiling time using the time_on or
time_slice options. See the descriptions in the list of options.
The following options are especially useful in most cases:
• For CPU time, clock time, and lock contention metrics with minimal intrusion, use -Xeprof
• For exact call count information and non-array object creation profiling, use
-Xeprof:inlining=disable
To see the complete list of available options, use java -Xeprof:help
-Xeprof always collects call graph data with inclusive method times (clock and CPU), method
call count, and lock contention metrics. This option uses tracing with reduction and collects the
data separately for each thread.
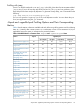
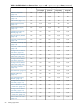
To see the availability of HPjmeter metrics from -Xeprof data collection, see –Xeprof and
–agentlib:hprof Profiling Options and Their Corresponding Metrics (page 79).
72 Profiling Applications