
HPjmeter 4.3 User's Guide
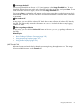
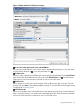
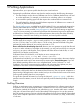

JMX server drop-down menu
The server from which this JMX viewer was launched is shown in the “JMX Servers” drop-down
menu.
JMX MBean drop-down menu
This drop-down menu lists the viewable MBeans for which data can be displayed in the viewer.
This list can get quite long when viewing data for application servers. To reduce the list length in
the drop-down menu, click the MBean filter button at .
JMX MBean tab navigation
Select an MBean, and the data for that bean is displayed in the four tabs appearing immediately
below the drop-down menus. Click among the tabs to looks at various aspects of the selected
MBean. Four tabs are available in the JMX server view: Attributes (page 64), Operations (page 66),
Notifications (page 67), and Information (page 67).
JMX MBean Details Viewer
In the Detail Viewer, you can drill down into the MBean data for details or to force an operation.
Using the Functions in the JMX Server View
The following discussion touches on the basic functions in this area of the JMX viewer.
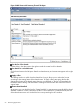
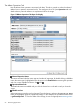
The MBean Filter
Click the MBean filter button to select a subset of MBeans to populate the MBean drop-down
menu.
A small window opens that gives you the following options for sorting the MBeans:
• by domain (for example, java.lang, com.bea)
• by name (for example, ClassLoadingImpl, MBeanServerDelegate)
• by type (for example,GarbageCollector, MemoryPool)
Select the filter type that you want, and click the Use Filter button.
Use the MBean drop-down menu to see the resulting list and to select an MBean to view.
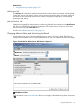
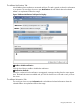
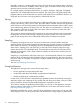
The MBean Attribute Tab
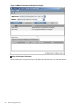
The Attributes tab lists the contents of the selected MBean. In general, two actions are possible at
this level: drill down to see values of an attribute and change the value of an attribute. The following
image shows an example. An explanation follows the image.
64 Monitoring Applications