
HPjmeter 4.3 User's Guide
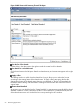
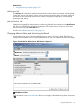
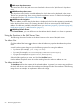
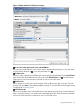
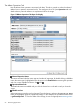
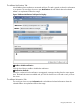
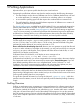

Figure 9 JMX Viewer with Summary Threads Tab Open
See the list of live threads
Pull the slider in the data pane to the right to reveal the current list of live threads.
See details for a selected thread
Click a thread name in the left pane. Details on thread activity and current state appear in the right
pane.
Apply a filter
This filtering text box is useful when the thread list is long. It allows you to reduce the list size
according to the starting letters of the thread name. To apply a filter, start typing the first few
distinguishing letters of the thread names that you are interested in. The list will immediately be
trimmed to entries starting with those letters. Deleting text from the filter box returns the list to its
original state.
Detect thread deadlock
At any point, you can check the box for “Detect Deadlock” to start monitoring specifically for thread
deadlock conditions. When a deadlock condition is encountered for a particular thread, the text
of the thread name turns red. Uncheck the box to stop watching for this condition.
62 Monitoring Applications