
HPjmeter 4.3 User's Guide
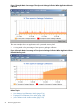
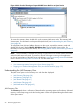
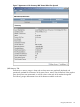
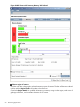

Figure 8 JMX Viewer with Summary Memory Tab Selected
Select a region of interest
Click the color bar in the graph to select the memory space of interest. The bar will become outlined
in blue and the Region Details will update in the text area.
Consult the Region Details for updated information on memory usage in that region, total count of
garbage collections, and cumulative duration of GC events.
60 Monitoring Applications