
HPjmeter 4.3 User's Guide
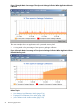
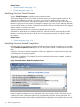
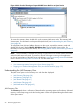
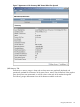
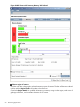

Figure 6 Main Console Showing an Expanded JMX Server Node in an Open Session
To access this summary data, double-click on the summary JMX server node. The summary JMX
Viewer opens. For information on this part of the JMX Viewer, see Understanding the JMX Summary
View (page 58).
To manipulate some JVM and MBean functions on this server, expand the summary node and
double-click the entry labeled Modify JMX MBean data. The server JMX Viewer opens. For
information on this part of the JMX Viewer, see Changing Mbean Values and Monitoring the Result
(page 63)
NOTE: This functionality is available only during an open session. No record of the actions taken
within the JMX viewer are saved. To preserve a record of changes occurring in the application
run due to manipulation of the JMX server and MBeans, save the monitoring session data for later
review. Use the monitoring metric visualizers to view the saved data.
See also
• View Monitoring Metrics During Your Open Session (page 39)
• Tapping in to Standard Management of the Java Virtual Machine (page 215)
Understanding the JMX Summary View
The JMX viewer opens in the Summary view with five tabs displayed:
• JMX Summary Tab (page 58)
• JMX Memory Tab (page 59)
• JMX Threads Tab (page 61)
• JMX Runtime Tab (page 63)
• JMX Notifications Tab (page 63)
JMX Summary Tab
The Summary tab shows a collection of data about the operating system and hardware, allocated
memory, current heap usage, and class loading status. Values are updated throughout the duration
of the open session.
58 Monitoring Applications