
HPjmeter 4.3 User's Guide


due to the stress on the JVM, such phenomena are typically much more costly than just running
this method exclusively in interpreted mode.
Repeated compilation problems may result in SLO violations and will affect some or all transactions.
Read the JVM Release Notes to learn how to disable compilation of selected methods for the HP
Java HotSpot Virtual Machine.
Related Topics
• Excessive Compilation Alert (page 128)
• Method Compilation Count (page 156)
• Method Compilation Frequency (page 157)
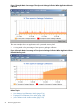
Identifying Too Many Classes Loaded
Use the Loaded Classes display.
This display can be used to determine if the pool of classes loaded into memory stabilizes over
time to a constant value, which is normal.
In some JVMs, like HotSpot, loaded classes are located in a dedicated memory area, called the
Permanent Generation, which is typically much smaller that the whole heap. If the application
repeatedly loads new classes, either from external sources, or by generating them on the fly, this
area overfills and the application abnormally terminates. This will correspond with the value of
this metric constantly growing up to the point of failure.
If you find that the application terminates because the number of loaded classes is too large for
the area of memory dedicated to this purpose, you can increase the heap area for the class storage
by using a JVM option. However, if changing the dedicated memory size will not help the situation
because the number of the loaded classes is unconstrained, this is an application design issue that
needs to be solved.
NOTE: An overflow of the area dedicated to class storage can cause the application to terminate,
sometimes with an OutOfMemoryError message, even if there is plenty of space available on
the heap. Consult your JVM documentation on how to increase the area dedicated for class storage,
if necessary.
Related Topics
• Loaded Classes (page 158)
• Class Loaders (page 173)
• Expected Out Of Memory Error Alert (page 128)
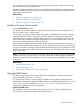
Using the JMX Viewer
The JMX viewer provides access to data collected from the operation of JMX servers inside the
Java Virtual Machine for Java 1.5.x versions.
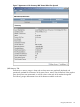
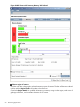
The viewer also provides you with the ability to interject in some operations of the JVM and to
manipulate the operation and attributes of MBeans that you have defined. Using HPjmeter monitoring
displays, you can observe the effect of changing the characteristics of MBeans that you have
loaded into the JMX server of the virtual machine.
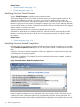
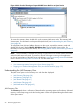
Opening the JMX viewer
On opening a session with an application running on Java 1.5.x, a data node displays in the
main console to represent current data collected from the JVM.
Using the JMX Viewer 57