
HPjmeter 4.3 User's Guide
• Array Leak Locations Alert (page 130)
• Class Loaders (page 173)
Checking for Proper Heap Sizing
Efficiencies in program performance can be obtained by allocating the optimal amount of memory
for the heap according to the needs of the program and the operation of the JVM garbage collection
routine. Checking activity in the heap and comparing to garbage collection frequency and duration
can help you determine optimal heap size needed for best performance from your application.
See the following sections for metrics that give insight into these aspects of the system:
• Current Live Heap Objects (page 147)
• Heap Monitor (page 140)
• Garbage Collections (page 141)
• Heap Usage Alert (page 129)
For detailed GC analysis, run your application with -Xverbosegc and use the HPjmeter GC
viewer to analyze GC activity in the heap. For additional details on memory usage, run your
application with -agentlib:hprof.
Confirming Java Memory Leaks
HPjmeter can automatically detect Java memory leaks, alerting you about the issue before the
application crashes.
After running for some time, Java applications can terminate with an out-of-memory error, even if
they initially had an adequate amount of heap space. The direct cause of this error is the inability
of the garbage collector to reclaim enough heap memory to continue.
The root cause of this problem is that some objects, due to the design or to coding errors, remain
live. Such objects, called lingering objects, tend to accumulate over time, clogging the heap and
causing multiple performance problems, and eventually leading to the application crash. Although
the nature of this phenomenon is different than memory leaks in C/C++, Java lingering objects
are also commonly called memory leaks.
A more subtle problem that can cause an out-of-memory error occurs when the Permanent Generation
area of memory becomes full of loaded classes. Running -agentlib:hprof can provide class
loading data that can help to reveal whether this problem is occurring.
Related Topics
• Expected Out Of Memory Error Alert (page 128)
• Garbage Collections (page 141)
• Current Live Heap Objects (page 147)
• How Memory Leak Detection Works (page 214)
• Java Collection Leak Locations Alert (page 129)
• Array Leak Locations Alert (page 130)
• Loaded Classes (page 158)
• Class Loaders (page 173)
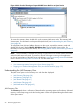
Determining the Severity of a Memory Leak
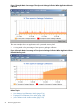
When HPjmeter automatically reports memory leaks, use the Garbage Collections and Heap Monitor
displays to help you visualize object retention. Object retention may indicate Java memory leak
problems.
Diagnosing Errors When Monitoring Running Applications 53