
HPjmeter 4.3 User's Guide
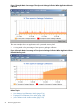
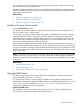
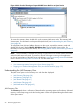
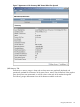
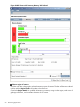

Figure 3 Example Metric: Percentage of Time Spent in Garbage Collection When Application Behavior
is Normal
This next example shows an application with a potential memory leak.
• A rising trend in the percentage of time spent in garbage collection.
Figure 4 Example Metric: Percentage of Time Spent in Garbage Collection When Application Shows
Potential Memory Leak
Related Topics
• How Memory Leak Detection Works (page 214)
• Expected Out Of Memory Error Alert (page 128)
• Java Collection Leak Locations Alert (page 129)
52 Monitoring Applications