
HPjmeter 4.3 User's Guide
You can verify this using a system tool like HP GlancePlus. The possible remedies for thrashing:
• Decrease the maximum heap size, which corresponds to a decrease of the maximum load
supported by the application.
• Eliminate other load on the system.
• Install more physical memory.
Related Topics
• Heap Monitor (page 140)
• Garbage Collections (page 141)
• Heap Usage Alert (page 129)
Identifying Excessive Calls to System.gc()
Use the Heap Monitor display.
When a high level of detail is selected (1 to 20 minutes), this metric can help detect if calls to
System.gc() are creating a performance problem. When your application calls this method,
you see that the heap size does not go to the local maximum before a garbage collection happens.
However, from time to time, the JVM may automatically invoke garbage collection in such
circumstance, too.
A rule of thumb is that if over half of all garbage collections seem to happen when the heap is not
full, then it may mean explicit calls to System.gc() are occurring. Remove explicit calls from
your application, either by modifying the code or by using an appropriate JVM option. These calls
rarely improve the overall performance of the application.
Related Topics
• Heap Monitor (page 140)
• Garbage Collections (page 141)
• Heap Usage Alert (page 129)
• Using Specialized Garbage Collection Displays (page 181)
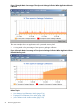
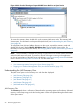
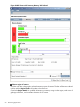
Reviewing the Percentage of Time Spent in Garbage Collection
The percentage of time your application spends in garbage collection can help you identify potential
problems. Use the % Time Spent in Garbage Collection display to view this information. For details,
see Percentage of Time Spent in Garbage Collection (page 143).
In this example, you see a fairly normal application behavior.
• A low flat graph
• A low average value, represented by the red line
Diagnosing Errors When Monitoring Running Applications 51