
HPjmeter 4.3 User's Guide
Related Topics
• Java Method HotSpots (page 136)
• Process CPU Usage Alert (page 131)
• System CPU Usage Alert (page 132)
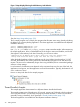
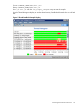
Viewing the Application Load
Use the Heap Monitor display.
This metric shows how busy the application is. It checks to see whether it is doing lots of allocations,
which typically corresponds to the load level, or whether it is idle.
When you select a coarse granularity of the view (1 to 24 hours), and assuming that there is no
memory leak, you will notice the overall change of behavior in heap size and garbage collection
pattern. This setting can help you understand the correlation between the application load and the
pressure on the heap.
If it seems a significant amount of time is spent in garbage collection, (gray in selected areas of
the display), it means that the heap was not adequately sized — it was too small for the load on
the application at that time. This behavior may also mean that the load was too high for the given
hardware and software configuration.
Related Topics
• Heap Monitor (page 140)
• Percentage of Time Spent in Garbage Collection (page 143)
• Heap Usage Alert (page 129)
Checking for Long Garbage Collection Pauses
Use the Heap Monitor display and select the shortest time interval.
Most garbage collections take several seconds at most to execute. Very large heaps, however,
may take up to several minutes.
Although the display does not show numerical values for the garbage collection duration, you can
look for extra wide garbage collection bars, which correspond to garbage collection pauses. They
will likely cause transient service-level objective (SLO) violations.
If intermittent, very long garbage collections are a potential problem in a given environment, you
can select appropriate garbage collection algorithms with a JVM option. Refer to your JVM
documentation.
Related Topics
• Heap Monitor (page 140)
• GC Duration (page 142) and GC Duration Alert (page 128)
• Garbage Collections (page 141)
• Heap Usage Alert (page 129)
• Data Collection with -Xverbosegc (page 94)
• Basic Garbage Collection Concepts (page 103)
Checking for Application Paging Problems
Use the Heap Monitor display, selecting a short time interval.
If multiple consecutive garbage collections take extraordinary time to run, this may indicate an
excessive paging problem, called thrashing, where the physical memory available to the application
is too small for the specified maximum size.
50 Monitoring Applications