
HPjmeter 4.3 User's Guide
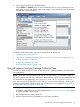
Start the node agent from the command line by typing:
$ JMETER_HOME/bin/nodeagent
where $JMETER_HOME has the default value of
JMETER_HOME=/opt/hpjmeter
You can run the node agent as a background process. By default, the node agent listens for console
connections on port 9505, but you can designate an alternate port number using this option:
-port port_number
Related Topics
• Working with Firewalls (page 32)
• Running Node Agent as a Daemon (page 47)
Stopping Node Agents
To stop a manually started node agent, abort the process.
Node Agent Access Restrictions
To make the JVM agent visible to the corresponding node agent, start a node agent with the same
group ID or user ID of each JVM process whose JVM agent uses the group_private (default)
or owner_private options. Node agents started as root will see all JVM agents regardless of
the ownership ID used on the JVM agent.
Running Multiple Node Agents
To run multiple node agents on the same managed node, each node agent must listen on a different
port to control visibility to JVMs. Use the node agent port option to specify a port number. Each
user or group must remember the port on which their node agent is running to connect to it.
To provide more secure access, run multiple node agents and use the owner_private or
group_private option for the JVM agent. For more information, refer to Node Agent Access
Restrictions (page 48).
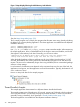
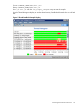
Saving Monitoring Metrics Information
HPjmeter offers two methods to save monitoring metrics information to a file.
• If you know in advance that you want to capture information for an entire application session,
you can run the JVM agent monitor_batch option when you start the application. See JVM
agent option monitor_batch[:file=filename].
When you save information using the monitor_batch option, the information is captured
from the start of the application session in a file on the managed node. To stop capturing
information, stop your application. For more information, see
monitor_batch[:file=filename].
• If you want to capture information from the start of the console session to the current time,
click File→Save as to name the saved data file. For details, see Saving Data from the Console
(page 49)
Each of these methods saves metrics information that you can later load into the console using the
Open File button or menu option., or dragging and dropping the file onto the console.
You can use these data files to capture information from live sessions to review later or to send to
a development team to show the state of your application.
48 Monitoring Applications