
HPjmeter 4.3 User's Guide
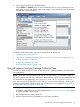
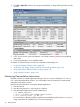
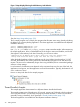
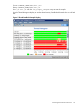
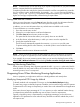
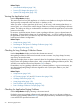

Figure 1 Heap Display Showing Possible Memory Leak Behavior
See also Heap Usage Alert (page 129).
The Pi sample program uses a simple Java program that allocates some arrays, thereby exhibiting
the behavior of a memory-leaking application. The demo application is available from the HPjmeter
installation directory:
Source: $JMETER_HOME/demo/Pi.java
Binary: $JMETER_HOME/demo/Pi.jar
Use -jar Pi.jar with the run_simple_jvmagent script to start the sample. When measuring
the sample application, allow considerable time for the heap to mature and stabilize, and for the
JVM agent to collect memory leak data. Eventually, you will see two alerts:
• Expected Out Of Memory Error Alert (page 110) with the leaking rate.
• Array Leak Locations Alert (page 112) with the leak location.
When the default garbage collectors and heap size for Java HotSpot Virtual Machine 1.5.0.07
are used, the detection of a memory leak for this demonstration program occurs after about 90
minutes. This time can be substantially longer when using a different JVM or nonstandard garbage
collector or heap settings.
In real situations, the detection time depends on the maximum heap size, the size of the leak, the
application running time, and the application and load characteristics. Typically, the detection will
occur in about two hours.
Here is an Array Leak alert for the sample program:
Thread Deadlock Sample
This sample application demonstrates how HPjmeter detects deadlocked threads.
The example creates pairs of threads every 30 seconds, stopping at 50 threads, which synchronize
work using shared locks. Occasionally, the program reverses the order in which locks are taken,
eventually causing a deadlock, which generates a Thread Deadlock Alert (page 133).
The demo application is available from the HPjmeter installation directory:
44 Getting Started