
HPjmeter 4.3 User's Guide
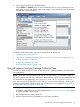

4. Click File→Open File to browse for and open the data file, or drag and drop the file onto the
console.
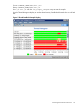
5. A GC viewer window opens and displays a set of tabs containing summary and graphical
metric data.
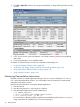
6. Click among the tabs to view available metrics.
For details on individual metrics and how to interpret the data display, see:
• Analyzing Garbage Collection Data (page 94)
• -Xverbosegc and -Xloggc Options and Their Corresponding Metrics (page 101)
• Using Specialized Garbage Collection Displays (page 181)
• Using Visualizer Functions (page 134)
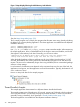
Monitoring Demonstration Instructions
HPjmeter includes two sample applications that you can run to see live examples of a “memory
leak” and a thread deadlock situation. You will be able to use the visualizers to examine data
during the demonstration session.
Here are the general steps for running the sample applications.
1. Start the console.
2. Start the node agent if it is not running as a daemon.
3. Start the sample application from the command line:
$ cd $JMETER_HOME/demo
$ export LD_LIBRARY_PATH=$JMETER_HOME/lib/$ARCH
$ java -agentlib:jmeter -jar ML1.jar
As a convenience, HPjmeter includes a script that sets up the library path and bootclasspath
using a JVM found at installation time. To use this script, type:
42 Getting Started