
HPjmeter 4.3 User's Guide
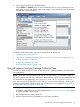
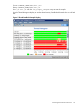

6. Click among the tabs to view available metrics.
Use the Metrics or Estimate menus to select additional metrics to view. Each metric that you
select opens in a new tab. Mousing over each category in the cascading menu will reveal the
relevant metrics for that category.
For details on individual metrics and how to interpret the data display, see:
• Collecting Profile Data (page 72)
• –Xeprof and –agentlib:hprof Profiling Options and Their Corresponding Metrics (page 79)
• Profiling Applications (page 69)
• Using Profile Displays (page 160)
• Using Visualizer Functions (page 134)
Using HPjmeter to Analyze Garbage Collection Data
The following steps summarize how to use HPjmeter to view garbage collection information from
your applications.
NOTE: If you are running the HP JDK/JRE 5.0.14 or 6.0.02 version, you can send a signal to
the running JVM to start and stop a verbose GC data collection period with zero preparation and
no interruption of your application. See Collecting GC Data with Zero Preparation (page 99).
If you are running the HP JDK/JRE 7.0.04 or later, you can also use the HPjmeter console to start
and stop a profiling data collection period with no interruption of your application. See Profiling
from HPjmeter with Zero Preparation (page 74)
1. Configure your application.
Change the command line of your Java application to use -Xverbosegc or -Xloggc options
to capture garbage collection data.
2. Run the application to create a data file.
3. Start the console from a local installation on your client workstation.
Using HPjmeter to Analyze Garbage Collection Data 41