
HPjmeter 4.3 User's Guide

NOTE: If you are running the HP JDK/JRE 5.0.04 or later, you can send a signal to the running
JVM to start and stop a profiling data collection period with zero preparation and no interruption
of your application. See Profiling with Zero Preparation (page 74). If you are running the HP
JDK/JRE 7.0.04 or later, you can also use the HPjmeter console to start and stop a profiling data
collection period with no interruption of your application. See Profiling from HPjmeter with Zero
Preparation (page 74)
1. Configure your application.
Change the command line of your Java application to collect the desired type of data: -Xeprof
to collect execution profiling information, -agentlib:hprof to generate heap dump at program
exit, or -XX:+HeapDump to enable generation of heap dumps using the SIGQUIT signal.
There are additional heap dump options. For more details, see the Java™ Troubleshooting
Guide for HP-UX Systems at http://www.hp.com/go/hpux-java-docs.
2. Run the application to create a data file.
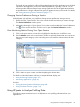
3. Start the console from a local installation on your client workstation.
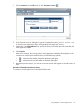
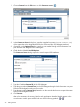
4. Click File→Open File to browse for and open the data file, or drag and drop the file onto the
console.
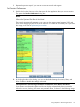
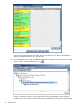
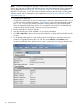
5. For all profiling data types, a viewer window opens and displays a set of tabs containing
summary and graphical metric data. You will also see the Metrics and Estimate menus
containing additional metric display choices, and a control menu for changing thread scope.
40 Getting Started